The best way to measure how many people are returning to the office is to actually count them. And the most reliable way to do that, with the largest sample size, is using daily security card swipes. For over two years, the Kastle Barometer has published occupancy return rates in ten selected cities with over 300,000 Kastle users (out of the 1.8 million total Kastle users globally).
How has the Barometer used this aggregated and anonymized data to earn its reputation for being the most robust, steady measure of back to work? The answer lies in our data science.
The Barometer’s Breadth, Depth and Type of Data
The Barometer was designed and is managed weekly by data scientists with decades of experience in large, sophisticated government data projects such as constructing the US Census. Kastle has over 1.8 million total users globally and the Barometer is based on the actual behavior of over 300,000 of these cardholders in the 10 markets we report on. It is important to note that with a sample size this large, our index relies on a meaningfully larger dataset than many of the most trusted and widely used economic and business statistical surveys. Examples include the Consumer Expenditure Survey from The Bureau of Labor Statistics based on monthly interviews with 20,000 households nationwide, the government’s Current Populations Survey used to produce monthly reports on inflation and employment based on 60,000 households nationwide, or private data like Nielsen television and radio ratings which are based on a sample of daily meters in 15,000 households nationwide. In fact, when you study a broad range of the most widely used economic surveys, you find that Kastle’s datasets are significantly larger, especially relative to what they are measuring.
In Manhattan, our data from 200 buildings and 70,000 cardholders represents the full range of New York City office occupiers and is drawn from a much broader set of properties within Manhattan than any publicly available source. This dataset not only includes iconic properties, with nearly two thirds of the sample coming from Class A commercial buildings, but importantly, also includes a range of other buildings that make this reflective of the city’s entire office real estate market.
Additionally, the Barometer dataset is not survey-based, but rather is based on actual card swipes when an occupant enters a building – data scientists call this “administrative records data” — which is a superior, statistical way to understand behavior than surveys measuring attitudes.
Consistent Alignment with Other Return-to-Office Indicators
With our robust dataset, it should come as no surprise that Kastle’s data is tightly aligned with other available sources tracking back-to-work trends. For example, the Partnership for New York City’s report that employers were seeing around 50% of workers back in the office after Labor Day, which aligns closely with our New York average of around 47% in recent weeks.
Additionally, Nick Bloom of Stanford University recently said Kastle’s data lines up with his Survey of Working Arrangements and Attitudes, and that he has “confidence in the accuracy” of the Barometer.
Deeper Insights on Daily Activity
We have recently started sharing more detailed views of the data that show a high variation between the days of the week. These additional views provide greater visibility into what comprises the Barometer’s weekly average and deeper insight into return-to-office trends.
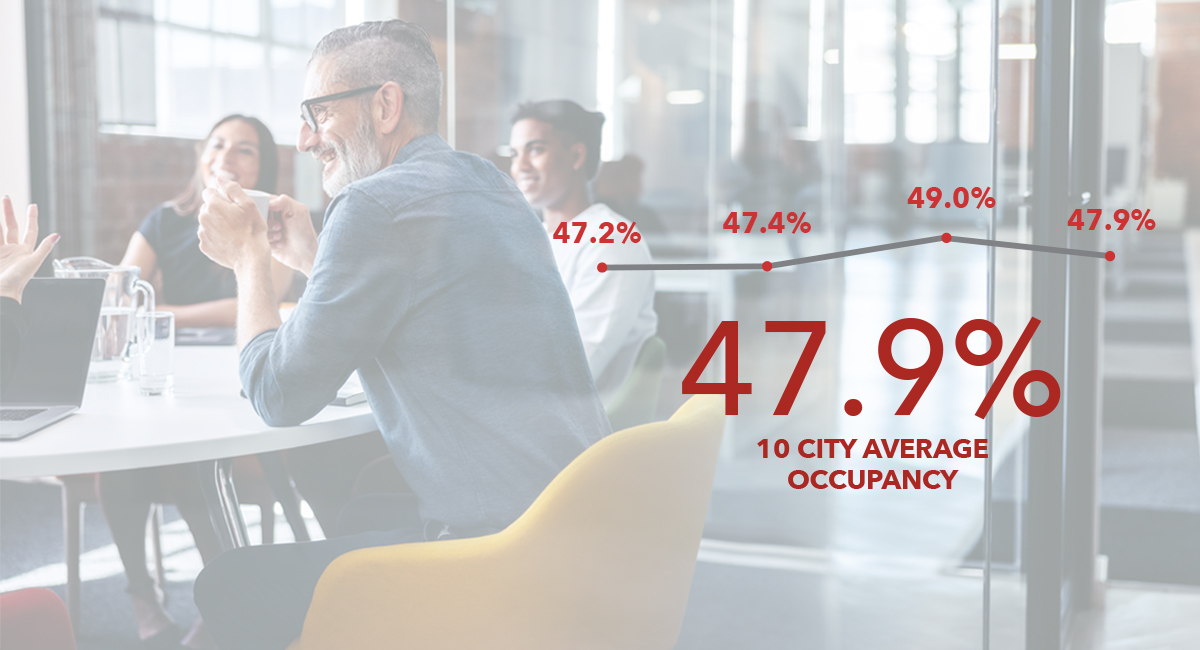
For example, mid-week is seeing peaks in occupancy across the country at 55.8%, but that occupancy is much lower on Mondays and Fridays with a low of 32.9% to derive a current weekly average of 47.9%. This phenomenon is even more pronounced in NYC where the mid-week high is nearing 60% and the Friday low is 26%, for an average occupancy level of around 47%. Indeed, peak occupancy days feel like the pre-pandemic bustling work environment, but our data doesn’t reflect that occurrence five days a week.
Additionally, insights drawn from the Barometer dataset confirm anecdotal reports about variations in occupancy based on building type – such as higher occupancy in newer, more high-end buildings. In fact, our law firm data sample, which typically includes higher-end buildings, has consistently been 10% higher than our main Barometer average throughout the pandemic.
The Definitive Source on Return-to-Office
Since the beginning of the pandemic, Kastle has been publishing the Barometer to arm real estate owners, decision makers and public sector leaders with the best data to inform critical decisions during this dynamic time. The breadth, depth, and data science methodology, along with the Barometer’s consistent alignment with other indicators demonstrate why it has become the most trusted and widely used return-to-office index in the country.