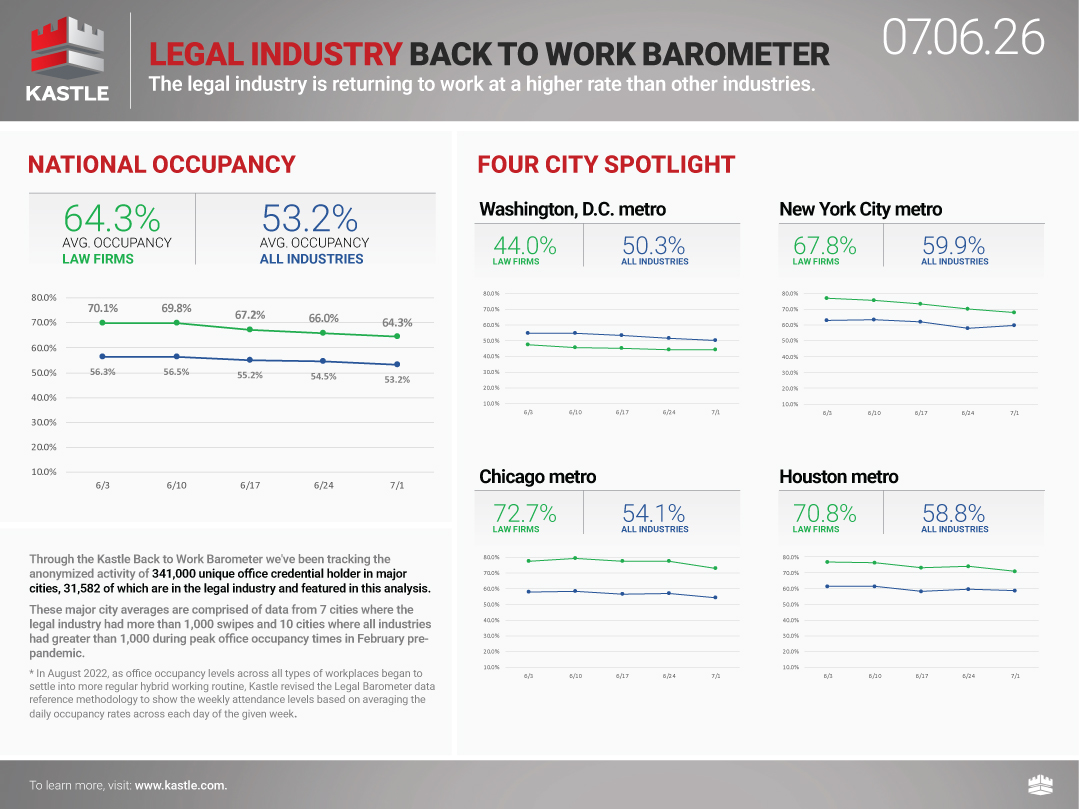
Those devoted to the Kastle 10-City Barometer know we have also reported on a monthly basis on occupancy at Law Firms within that universe. Generally, over the last 4-5 years, workers in law firms have been reporting to work at higher rates than all workers. On average, the difference between law firm occupancy and all workers has been 12.5% higher since April 2022 when we started tracking law firms. That difference has been as high as 19.5%, and as low as 7.2%. Lately that gap is narrowing, with the average for March and April of this year at 9.7%.
Our law firm report has reliable data for just seven of the ten cities in the Barometer. Last month, law firm occupancy across the country was significantly higher than the Barometer, with Dallas law firms leading the way at 73.5%, Los Angeles at 72.7%, Houston at 71.6%, Chicago at 70.8% and New York metro at 68.6%. Two cities in the report have been outliers over time. San Franciso has been much lower, and nearly the same as their Barometer number. Last month it came in at 46.2% for law firms, and 45.1% for all workers. Washington, D.C. has been the reverse of the national pattern. Their monthly law firm occupancy was only 44.4%, while all workers reported in at 54.2%, almost 10 points higher.
Kastle will now publish the Legal Barometer during the first week of each month, and it will include the past four weeks.
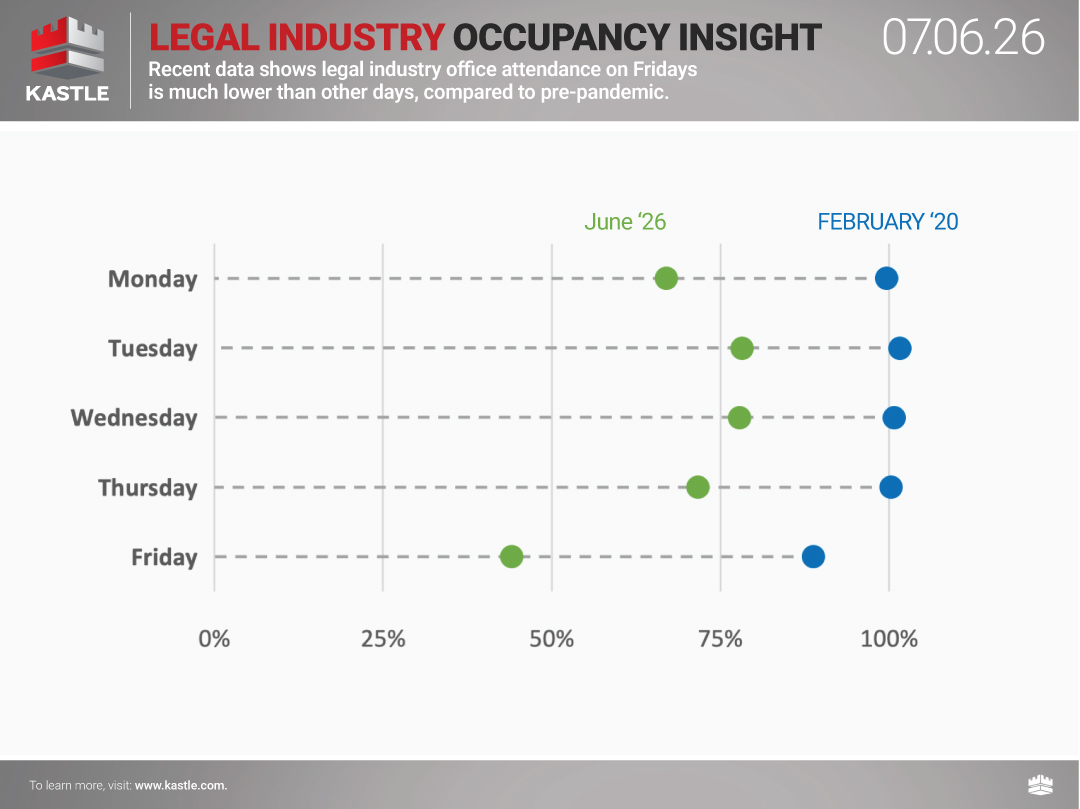
The chart below shows the variability by day for Legal workplace occupancy with the figures reflecting the daily averages for the preceding four weeks, compared to the daily averages pre-pandemic. Note that Mondays and Fridays have much lower office attendance relative to the middle-of-the-week days compared to pre-pandemic.
About Kastle
With extensive depth in the legal industry securing 49 firms of the AmLaw100, Kastle Systems, the country’s largest managed security services provider to commercial businesses, is sharing anonymized aggregated access data from Kastle-secured businesses in the legal industry to better understand office occupancy patterns following COVID-19.
*August 2022 Update to Legal Industry Data Analysis:
Since April 2021, Kastle has provided a weekly analysis of access activity data from businesses in the legal industry in seven markets. Until now, the Legal Occupancy Barometer tracked whether an employee came in any one of five days of the week. This was published along with Kastle’s national data from the ten-city Barometer, which analyzes weekly average attendance for each day of the week.
As office occupancy levels across all types of workplaces began to settle into a more regular hybrid working routine, Kastle revised the Legal Occupancy Barometer to provide a more refined view of occupancy by analyzing the average of access activity data for each day of the week. The enhanced analysis takes into account the new pattern of office work, in which people are more likely to split their time between the office and home. This adjustment allows for richer detail on legal industry occupancy and better aligns the analysis with the ten-city Barometer.
Ready to make your property smarter and more secure? Connect with Kastle's experts to find the perfect solution tailored to your needs.

 Workplace Occupancy Barometer
 Legal Occupancy Barometer