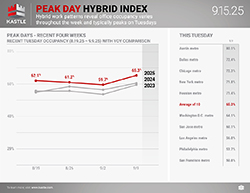
Hybrid work patterns reveal occupancy varies throughout the week with Tuesdays typically being the highest day of the week and Fridays being the lowest. The chart below tracks Tuesday occupancy over time in ten cities and provides a new dimension to the weekly Barometer report. The Peak Day Hybrid Index will now be published weekly, offering a wider aperture into the full picture of workplace occupancy.


Get Weekly UpdatesYou can now track the Return to Work Barometer on the Bloomberg Terminal, available under {ALLX KASL<GO>}


Workers Return to the Office in Record Numbers
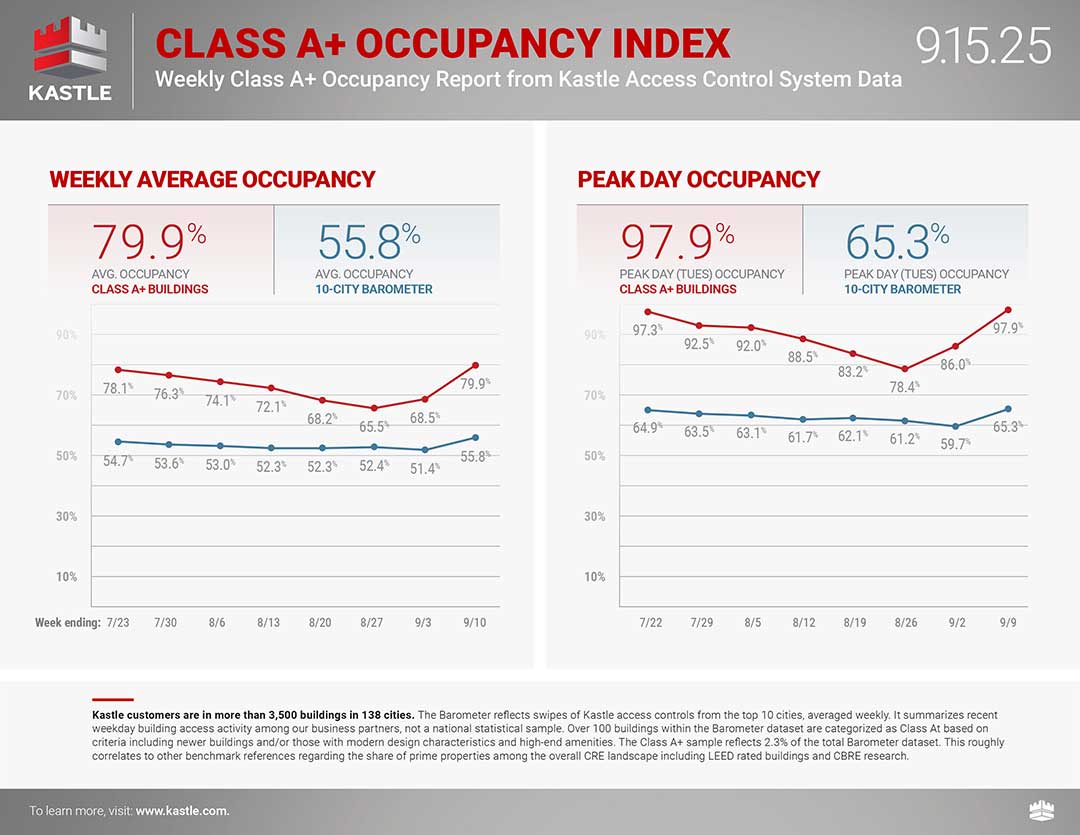
Peak day office occupancy was 65.3% on Tuesday last week, up 5.6 points from the previous week, as workers returned to the office in record numbers in the first full week after the Labor Day holiday weekend. New York City and Washington, D.C. experienced post-pandemic record-high Tuesday occupancy, rising 10.7 points to 71.8% and 5.1 points to 64.1%, respectively. Occupancy increased every day in nearly every city, which is a similar pattern to previous years as the summer travel season ends. The average low was on Friday at 36.9%, up more than six points from last week.
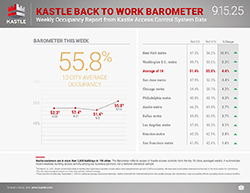
Weekly average occupancy rose 4.4 points from the previous week to a post-pandemic record high 55.8%, according to the 10-city Back to Work Barometer, nearly a full point higher than the prior record set in July. Occupancy increased by more than a full point in every tracked city. New York City, Washington, D.C., and Dallas all experienced post-pandemic record highs, rising 10.9 points to 58.2%, 5.3 points to 55%, and 3.7 points to 63.5%, respectively.
Last week, Class A+ peak day occupancy rose 11.9 points to 97.9% on Tuesday, six tenths of a point above the previous post-pandemic record high set in July. Weekly average occupancy among the Barometer’s Class A+ buildings was 79.9%, up 11.4 points from the previous week and a post-pandemic record high. We will continue to provide insights from this subset of over 100 buildings within the Barometer dataset, which have been categorized as Class A+.
Methodology
To provide some clarity on the issues facing American businesses, Kastle has been studying keycard, fob and KastlePresence app access data from the 2,600 buildings and 41,000 businesses we secure across 47 states. We’re analyzing the anonymized data to identify trends in how Americans are returning to the office.
We have tracked and published U.S. office occupancy status in Kastle-secured commercial properties since the beginning of the Covid crisis in early 2020. We continue to seek to help companies navigate the ever-changing workplace landscape and adjust to the ‘new normal’ of office occupancy. Whether full-time hybrid or in-person, our commitment remains to helping American businesses understand how average workplaces are being attended weekly, monthly, and annually.
Kastle’s reach of buildings, businesses and cardholders secured generates millions of access events daily as users enter office complexes, and individual company workspaces. The Barometer weekly report summarizes access control data among our business partners in ten major metro areas, not a national statistical sample. Charted percentages reflect unique authorized user entries in each market relative to a pre-COVID baseline, averaged weekly.*
*On March 22, 2021, Kastle moved from daily to weekly data reporting to provide a more robust and comprehensive picture of office occupancy. We have also recalculated data back to the start of the time series for consistency. This has only a marginal impact on most cities and the national average.
Click here for more information about the Barometer methodology and FAQ
Ready to make your property smarter and more secure? Connect with Kastle's experts to find the perfect solution tailored to your needs.

![]()
 Workplace Occupancy Barometer
 Legal Occupancy Barometer
 Barometer Data Science