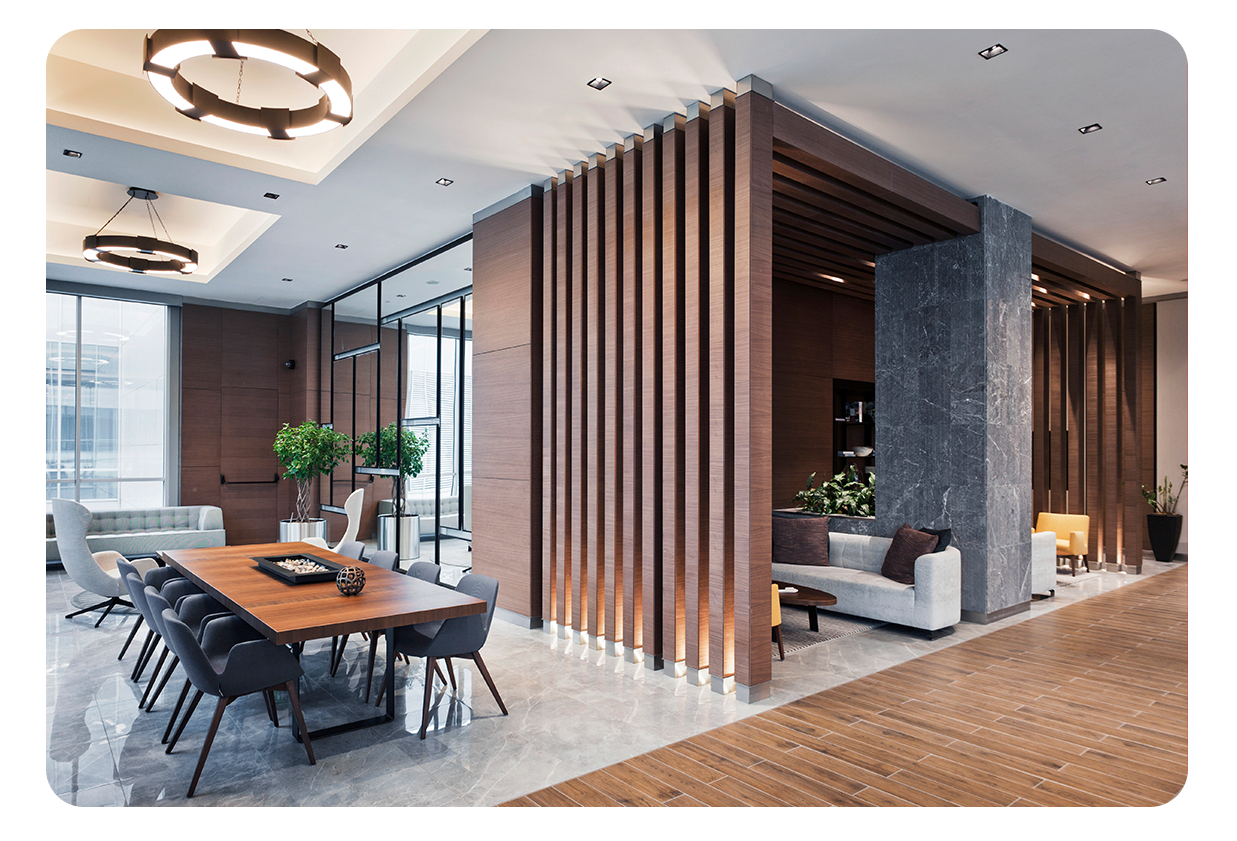
If more American workers ended their commute by walking into offices brimming with modern amenities, high-end décor, and other fine touches, might they come to work more often?
We recently sought to test this hypothesis. That is, that newer buildings preferred by some tenants to in part recruit and retain a workforce — so-called A+, or A++ buildings, or those with modern design qualities, the best construction and offering high-quality building amenities — draw more tenant companies to locate or maintain their offices in those locations and thus have higher occupancy rates than other buildings. Based on new research Kastle conducted, there is strong evidence to support this viewpoint.
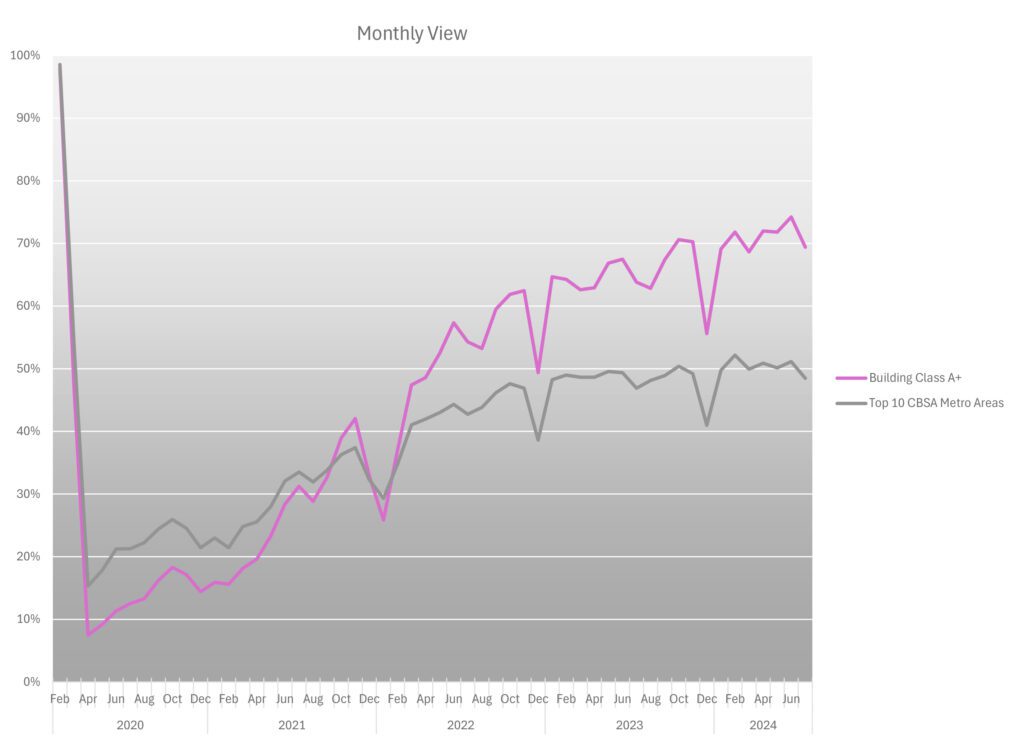
From June 1-June 30 of this year, 113 A+ buildings we studied in our Kastle Back-To-Work-Barometer data set had an average daily occupancy of 74.2% compared with 52.1% for all the buildings in our 10-City Barometer. Tuesdays were consistently the highest occupancy day for the A+ buildings, reaching a single day high of 94.3% on Tuesday, June 4th. Significantly, Fridays in these A+ buildings during June were much lower, with an average of just 40.1% occupancy. This is a bit above the 10-City Barometer average of 33.4%.
We uncovered this new finding through our constant efforts to provide new insights into commercial office work patterns. We conducted a deep dive into the rich dataset of the Kastle Back-To-Work-Barometer that has been reporting the occupancy rates measured across 10 major cities for the last 55 months since the start of the Covid pandemic. To begin, we applied building characteristics data from CoStar and identified 113 buildings, representing 4.2%, from the 2,600 in the barometer data set we labeled “A+”.
Interestingly, when we looked back across the four plus years since the start of the Pandemic, these A+ buildings performed much like all others until separating from the pack consistently in 2022. We welcome comments on why this might have been the case, as this chart shows:
These A+ buildings featured CoStar ratings of both “Class A” and “4 or 5 star.” Ensuring we only focused on the highest quality buildings, we selected only those with over 100,000 leasable square footage and are located in urban corridors or prime suburban areas. We also included only buildings built after 2010, most of which are LEED-certified as well. For context, the share of commercial real estate with a LEED rating ranges from 1% to 3% nationwide, which is in line with our analysis. Our A+ sample reflects 2.3% of our Barometer universe of buildings, right in the middle of that range.
While building amenities are one of several factors to consider as a contributor to higher occupancy, the types of tenants might matter, too. For example, Kastle’s Legal Occupancy measure, which we have been reporting for several years, has shown that workers at law firms consistently go into the office at higher rates than their peers in other businesses. For May 2024, Kastle’s 7-city Law Firm average reached 66.4% occupancy, approaching the 70% measure for the A+ buildings.
Office occupancy is at its highest level since the pandemic began, recently reaching a Peak Day average of 61.3% of the weekly pre-Covid average occupancy. We’ve seen more than 90% on peak days in first class buildings. That comparative ratio is based on a 5-day in-office routine that doesn’t necessarily exist today because employers are asking staff to spend about three days a week in the office. That’s why even these values are understated.
These are just a few more data points and bits of context to consider as we try to find our new normal. Just as we have done since reporting Peak Day activity last fall, we will keep studying the data to offer the important insights needed to better serve our customers and the industry.
*The Kastle Back to Work Barometer uses average weekly attendance counts (first-time card swipes each day then averaged across the five-day week) of February 2020 as the pre-pandemic benchmark attendance level and timeframe – e.g., the average weekly attendance counts captured at that pre-pandemic timeframe are what all subsequent daily and weekly attendance counts are compared to as a relative percentage, with February 2020 counts as the denominator, and current count each day as the numerator.


