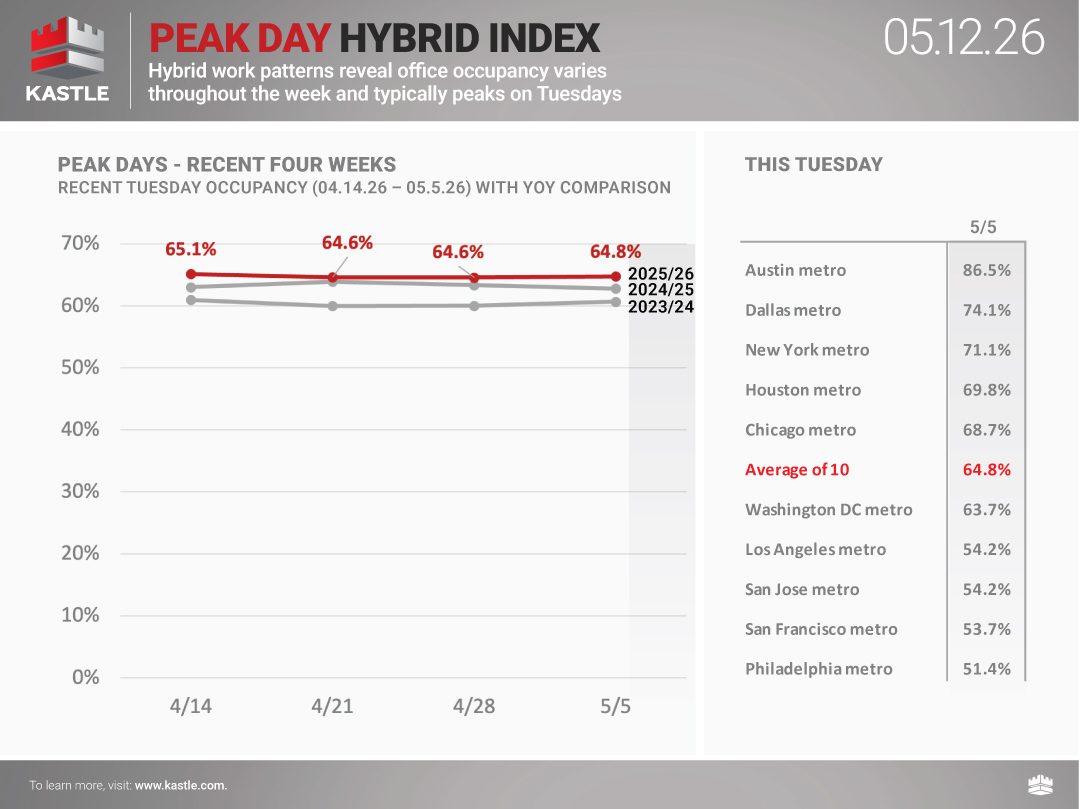
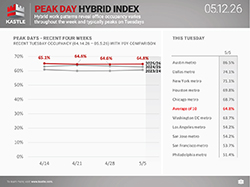
Hybrid work patterns reveal occupancy varies throughout the week with Tuesdays typically being the highest day of the week and Fridays being the lowest. The chart below tracks Tuesday occupancy over time in ten cities and provides a new dimension to the weekly Barometer report. The Peak Day Hybrid Index will now be published weekly, offering a wider aperture into the full picture of workplace occupancy.
Get Weekly UpdatesYou can now track the Return to Work Barometer on the Bloomberg Terminal, available under {ALLX KASL<GO>}
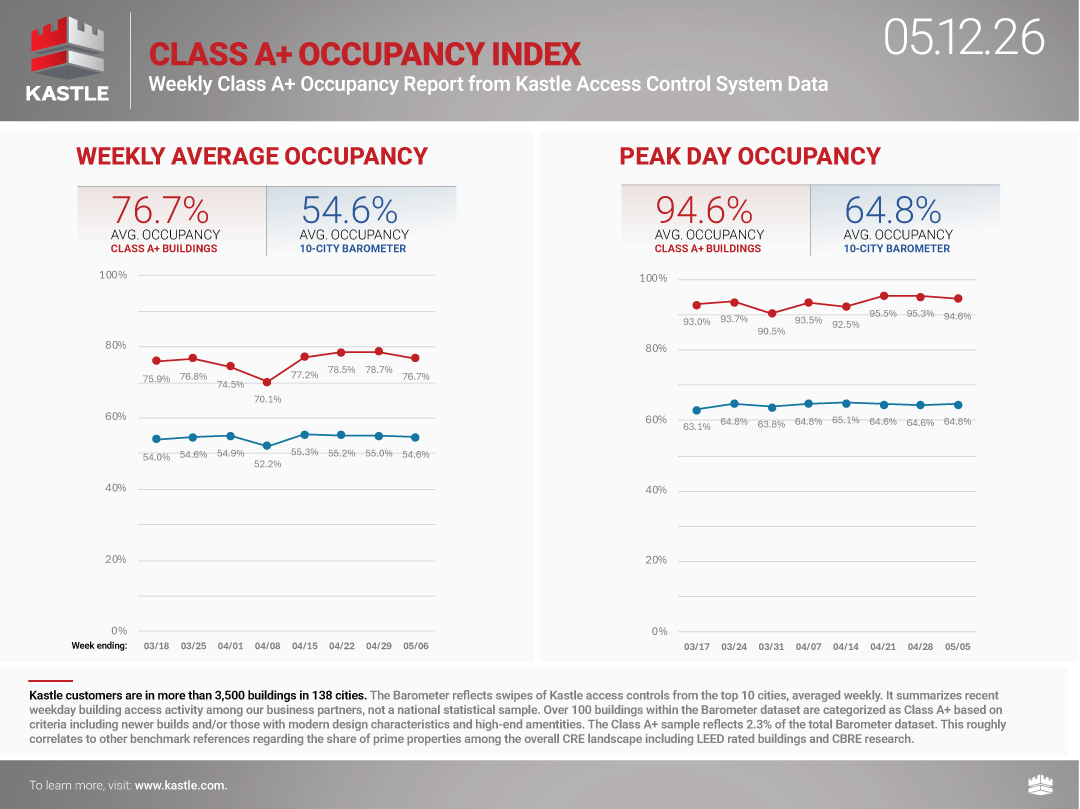
Class A+ Occupancy
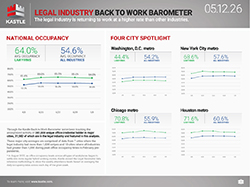
For the week ending May 13, Class A+ buildings resumed the upward trend seen in April, reaching a national average occupancy of 78.6%. That is just 2.2 points below the highest national average recorded since January 2025, at 80.8%. Tuesday remained the peak day, rising to 95.8%. This week’s data make clear that last week’s decline was driven solely by New York City. In Los Angeles and Dallas, however, Class A+ buildings peaked on Wednesday, breaking from the Tuesday pattern seen in the other eight cities measured.
Peak Day
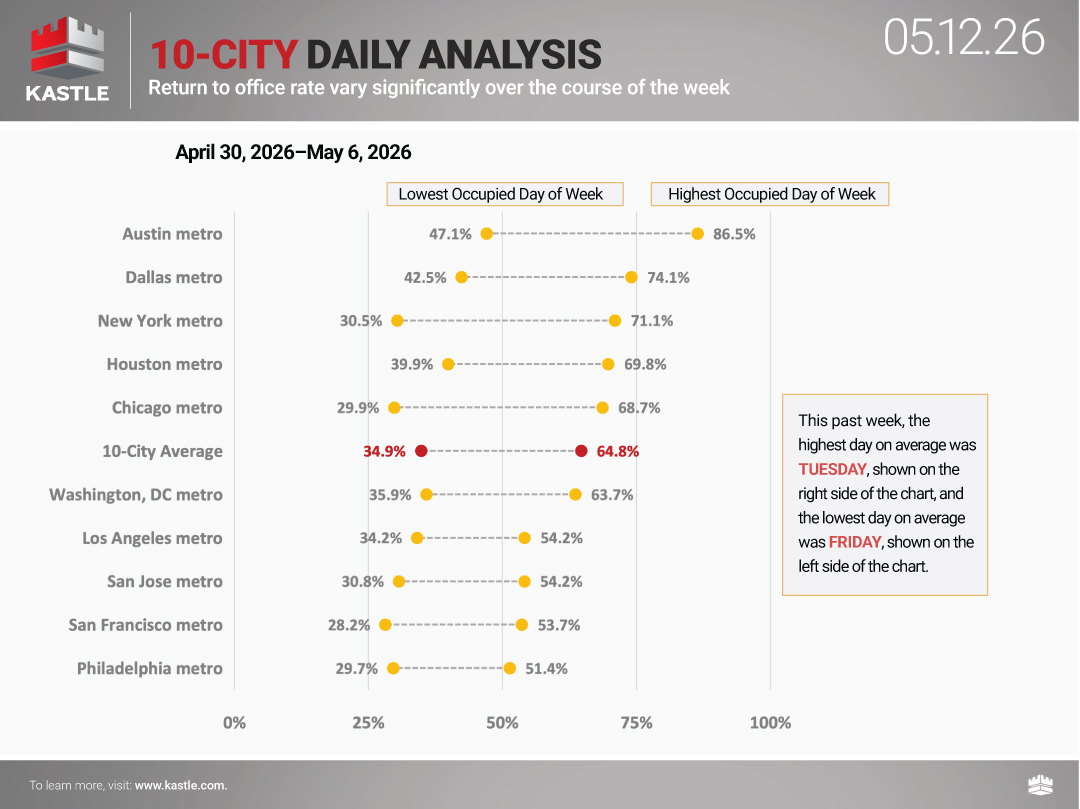
All ten cities in the Kastel Barometer reported the peak day last week as Tuesday, May 12th, with the national average occupancy of 65.2%. This is the highest the peak day for all building types since the first week of March this year. Regional patterns continue to be very stable. Austin (89,5%) had the highest peak day value, followed by Dallas (72.9%), New York (72.0%, Chicago (69.7%), Houston (69.4%), DC (65.9%), San Francisco (55.1%), Los Angeles (54.9%), San Jose (53.3%) and Philadelphia (51.2%) .
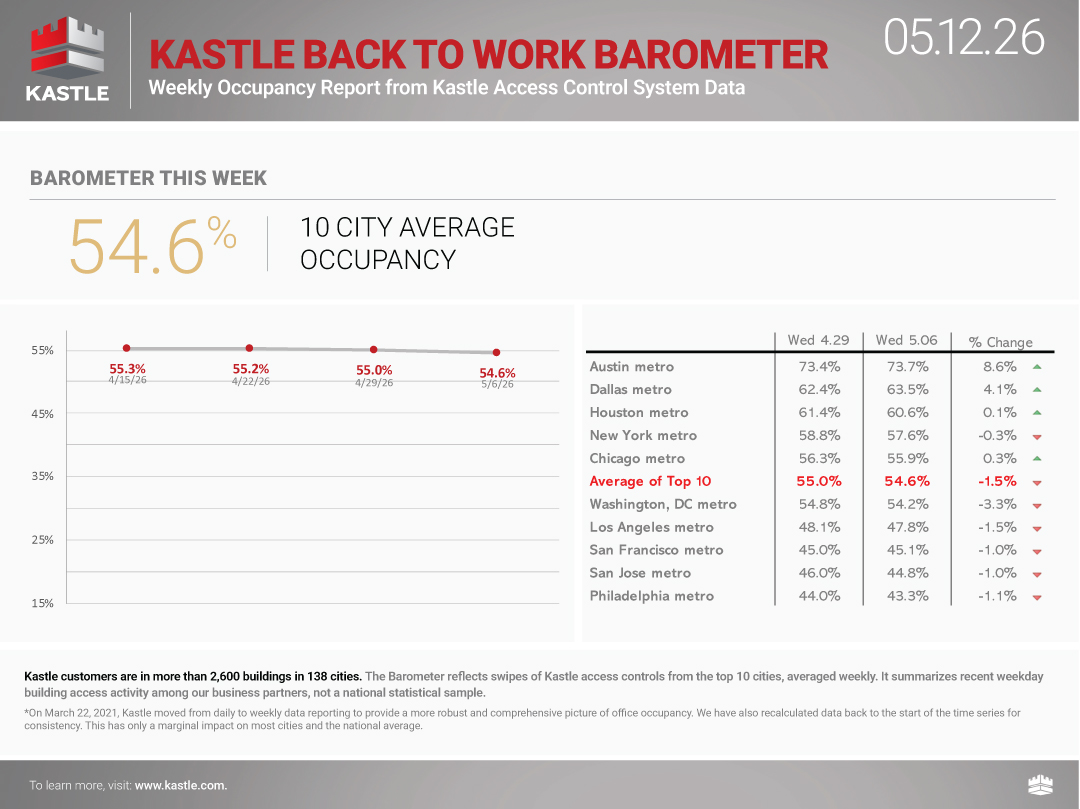
Weekly Average
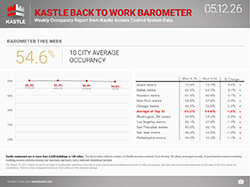
The Kastle Barometer national weekly average occupancy was also up this week, rising four tenths of a point to 55%. Six of the ten cities reported an increase in average weekly occupancy and four reported slight drops. Austin was the biggest mover, up 1.9 points to 75.5% average weekly occupancy. New York was close behind, gaining 1.4 points to an average occupancy of 58.9%. Houston, Chicago, San Franciso and Los Angeles reported smaller gains. Dallas, San Jose, and Philadelphia very small drops in average. With two weeks of data, May is looking more like the higher April, than the slightly lower March.
Methodology
To provide some clarity on the issues facing American businesses, Kastle has been studying keycard, fob and KastlePresence app access data from the 2,600 buildings and 41,000 businesses we secure across 47 states. We’re analyzing the anonymized data to identify trends in how Americans are returning to the office.
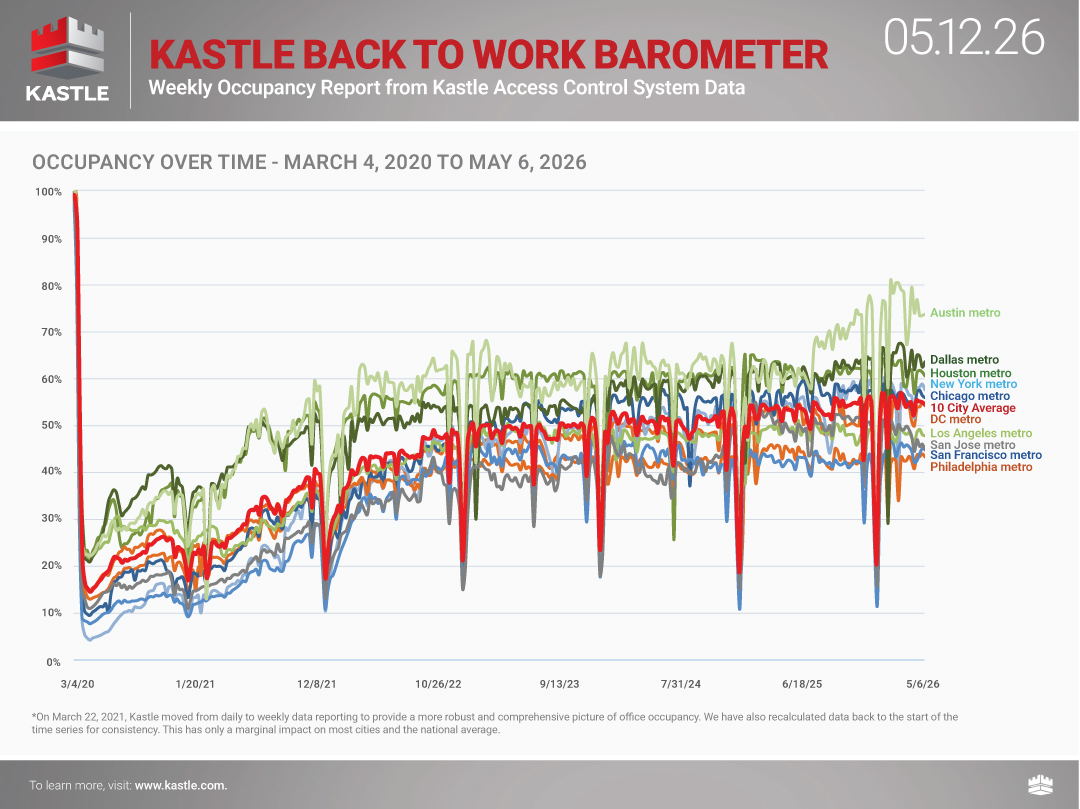
We have tracked and published U.S. office occupancy status in Kastle-secured commercial properties since the beginning of the Covid crisis in early 2020. We continue to seek to help companies navigate the ever-changing workplace landscape and adjust to the ‘new normal’ of office occupancy. Whether full-time hybrid or in-person, our commitment remains to helping American businesses understand how average workplaces are being attended weekly, monthly, and annually.
Kastle’s reach of buildings, businesses and cardholders secured generates millions of access events daily as users enter office complexes, and individual company workspaces. The Barometer weekly report summarizes access control data among our business partners in ten major metro areas, not a national statistical sample. Charted percentages reflect unique authorized user entries in each market relative to a pre-COVID baseline, averaged weekly.*
*On March 22, 2021, Kastle moved from daily to weekly data reporting to provide a more robust and comprehensive picture of office occupancy. We have also recalculated data back to the start of the time series for consistency. This has only a marginal impact on most cities and the national average.
Click here for more information about the Barometer methodology and FAQ
Ready to make your property smarter and more secure? Connect with Kastle's experts to find the perfect solution tailored to your needs.

![]()
 Workplace Occupancy Barometer
 Legal Occupancy Barometer
 Barometer Data Science