About the Barometer report
Office occupancy is a key indicator of how commercial real estate is performing, offering insight into how businesses are using their space. In many markets, Class A+ buildings have continued to attract tenants and command higher rents, even as the broader office sector adjusts to new ways of working. Kastle’s Barometer adds to this picture with proprietary, real-world occupancy data, tracking how buildings are used day to day.
How the data is tracked
Kastle’s Barometer tracks anonymized keycard, fob, and app access data from over 300,000 Kastle users across ten major cities to identify trends in how Americans are returning to the office.
Counting daily access control entries is the most reliable way to measure office return, with the largest sample size of its kind. Occupancy is measured against a pre-pandemic baseline established in early 2020, just before COVID-19 disrupted office attendance. Data is updated weekly, with monthly charts available to track trends.
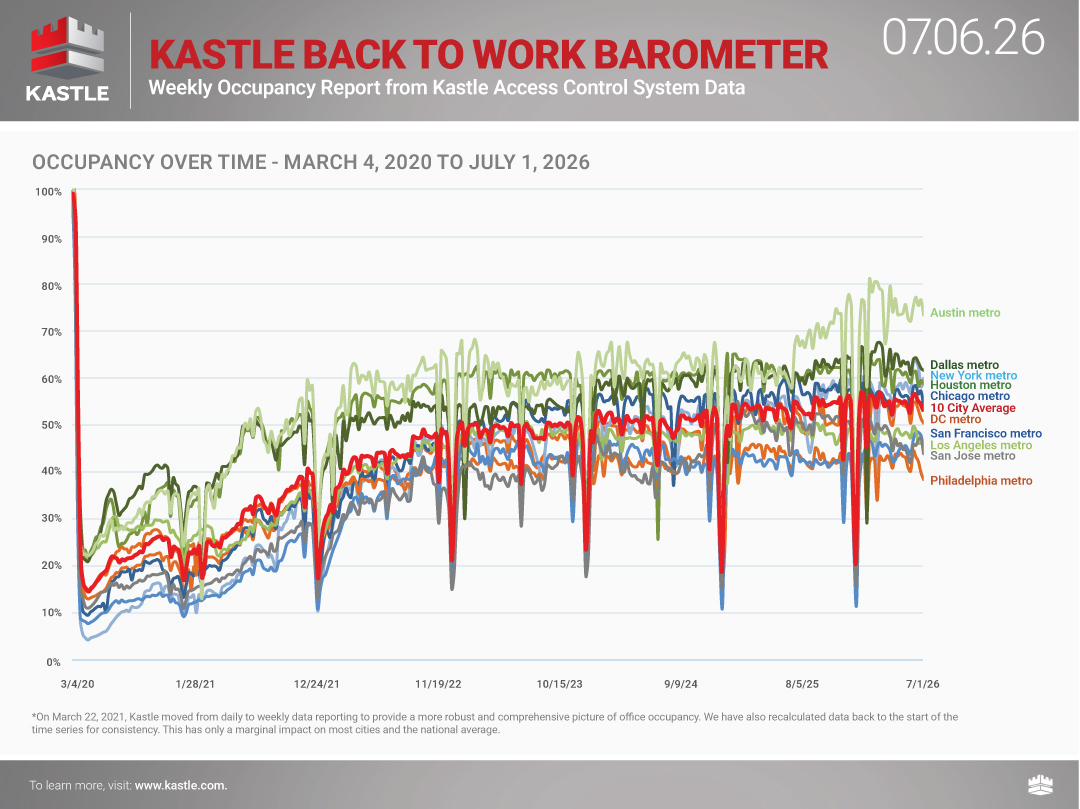
The Barometer’s weekly report summarizes access control data from our business partners in 10 major metro areas, not a national statistical sample. Charted percentages reflect the number of unique authorized user entries in each market relative to a pre-COVID-19 baseline, averaged weekly and updated every Tuesday.
Class A+ Occupancy
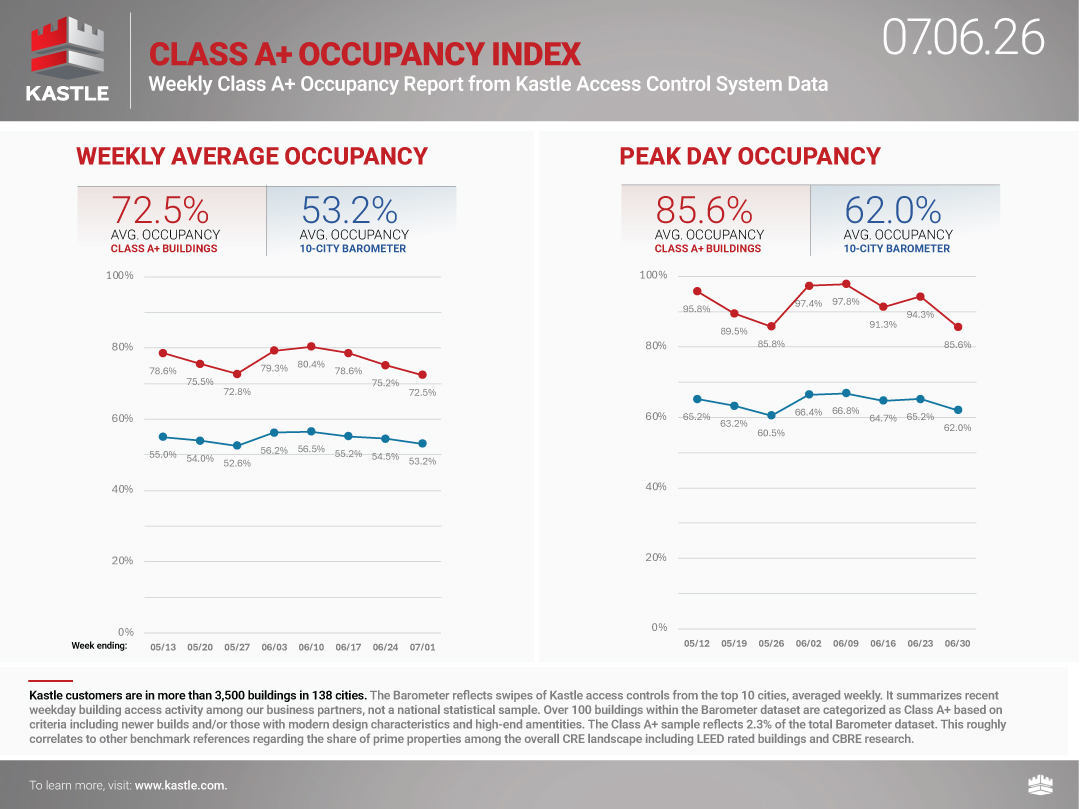
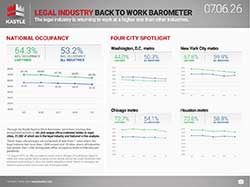
Workers in Class A+ buildings reported to work at slightly lower levels for the third consecutive week, as the summer lull persists. Average occupancy was 72.5%, down from the above 80% highs of the last week of May and the first week of June. Attendance on the peak day, Tuesday, was 85.6%, which is significantly lower than the 93.3% average over the previous eight weeks of peak day Tuesdays. Nonetheless, Class A+ buildings clearly demonstrated their strong appeal, as all other classes of buildings combined averaged 62.0% for the same Tuesday peak day last week, more than a 25-point difference in favor of Class A+.
Peak Day
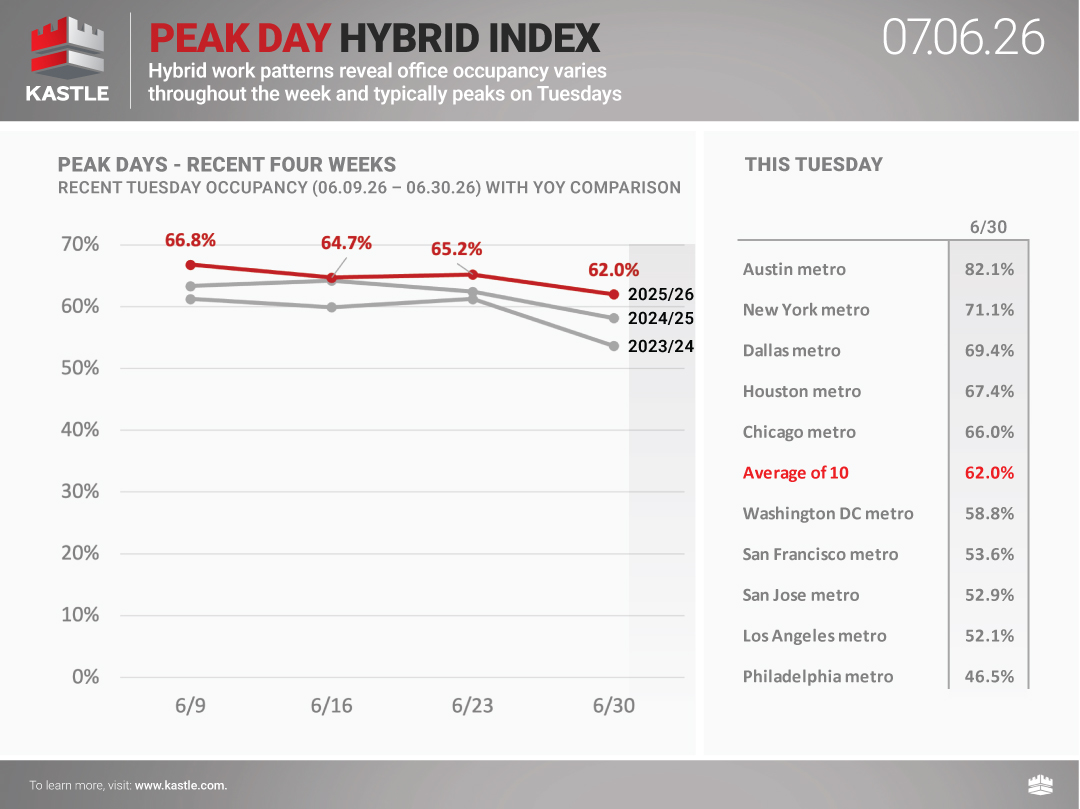
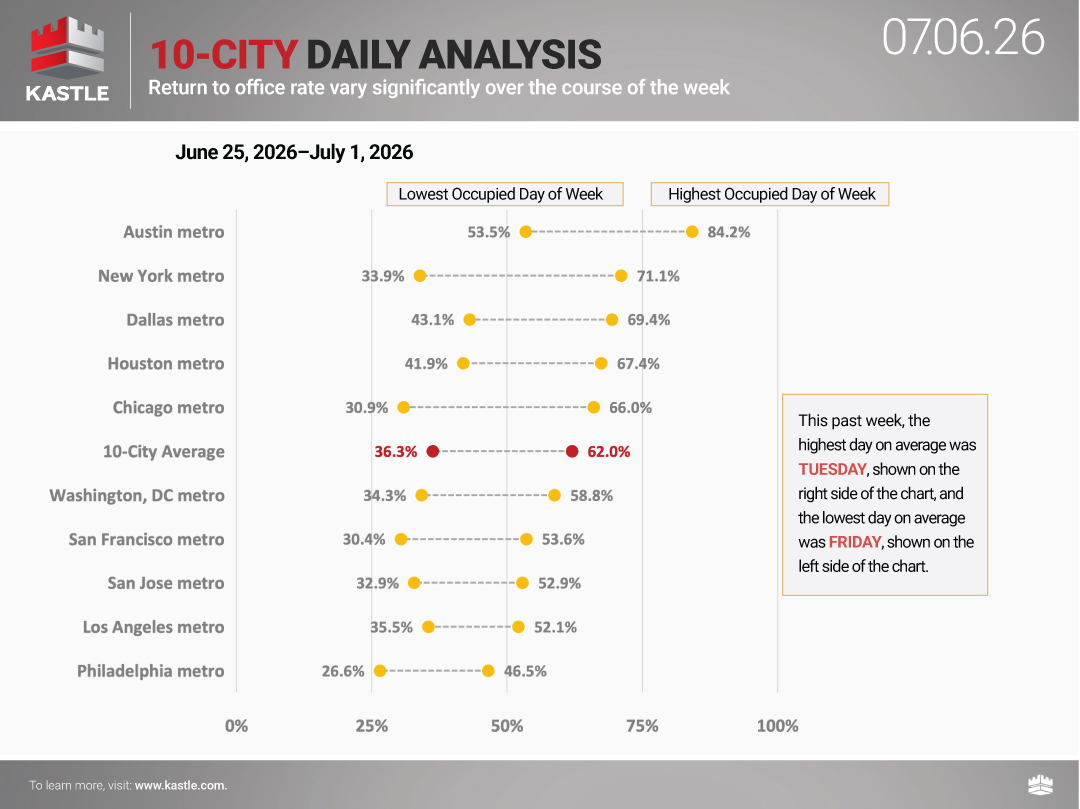
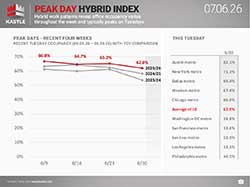
The national average peak-day occupancy was Tuesday again, although measurably down from the prior week at 65.2% to 62.0%. Nine of the ten cities reported Tuesday as the peak day, with one significant outlier. Austin reported Thursday, June 25 as its peak day, at an astonishing 84.2%. For the week, Austin had three days over eighty percent, including Tuesday at 82.1% and Wednesday at 81.2%. Office workers may have been enjoying workplace air conditioning and getting away from the very high temperatures and humidity for that week, or just avoiding the onset of the usual Texas Saharan dust plume on Monday, June 29.
Weekly Average
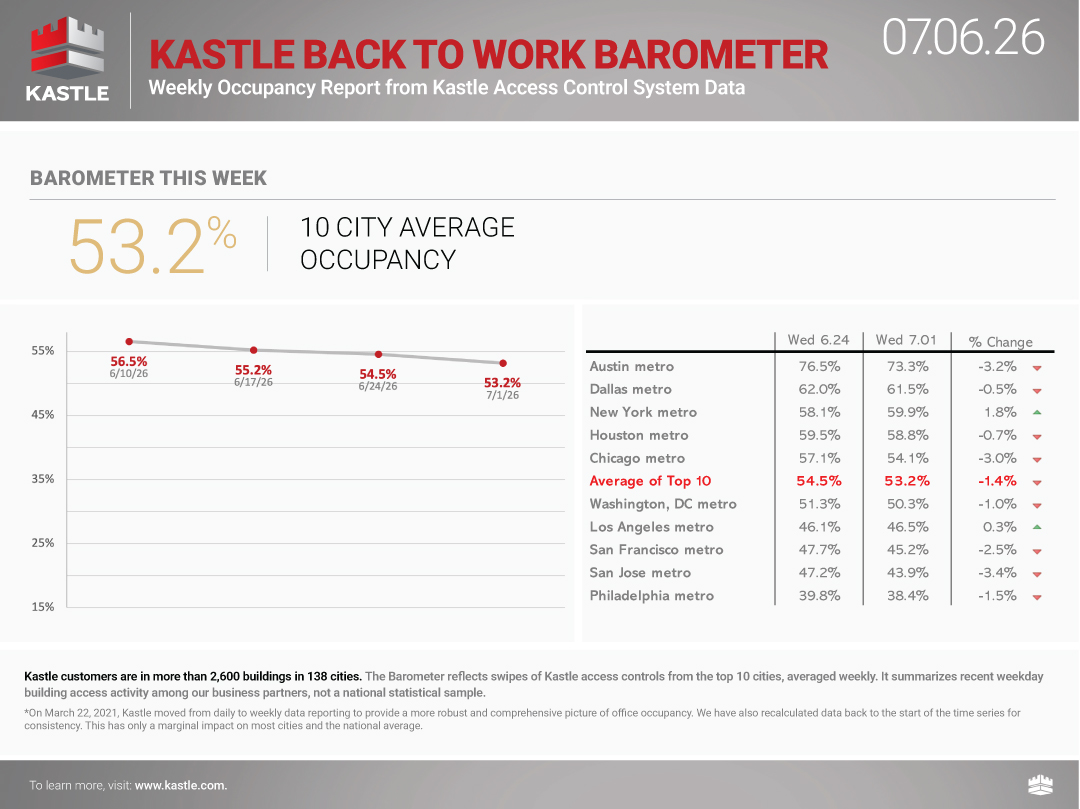
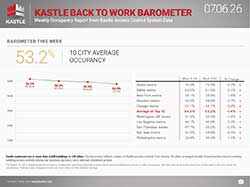
National average office occupancy for the 10-City Back-to-Work Barometer dropped slightly for the third straight week, down from 54.5% last week to 53.2%. Only two of the ten cities reported an increase: New York City metro was up 1.8% to 59.9%, and Los Angeles was up three-tenths to 46.5%. Nationally, it was a mixed result this week, with five cities reporting increases and five others reporting decreases. Among the 8 cities reporting declines, San Jose declined the most, dropping 3.4% to 43.9%, followed by Austin, down 3.2% to 73.3%, and Chicago, down 3.0% to 54.1%. As we enter July and summer vacations, we expect occupancy levels to remain similar until school starts up again.
Barometer data science
The most reliable way to measure office return is to count people directly, and daily security card swipes provide the largest sample size for this. For several years, Kastle’s Barometer has tracked weekly office occupancy in ten major metro areas, using anonymized keycard, fob, and KastlePresence app data from over 300,000 Kastle users in those cities (out of 1.8 million Kastle users globally) across 3,400 buildings and 60,000+ businesses in 47 states.
For each cardholder, we count only their first building entry each day, avoiding overcounting from multiple swipes. These daily figures are averaged into a weekly percentage.
That percentage is compared against a pre-pandemic baseline: the average weekly first-swipe activity during a three-week window in February 2020, when office attendance was at its highest. This baseline represents 100%, reflecting normal peak occupancy rather than maximum capacity, which is why some weeks can register above 100%.
Q: What timeframe does the Barometer cover?
A: The Barometer week runs Thursday through Wednesday, and weekly reports are typically published on Tuesdays. For example: the report published on Tuesday, October 4, reflects data from Thursday, September 22, through Wednesday, September 28. Federal holidays and weekends are not included in the data.
Q: Can I get Kastle data for a city not included on the Barometer?
A: Kastle secures buildings in cities across the country. We do not publicly release office occupancy rate data for cities outside the ten Barometer markets due to sample sizes for statistical analysis. We occasionally share limited data reflecting other markets with government and nonprofit organizations and partners, but it is not intended for public consumption.
Q: What is the margin of error?
A: The Barometer relies on administrative data (card swipes). The Barometer reflects the universe of all transactions rather than a sample and therefore has no margin of error. “Margins of error” are statistical measures that derive from expected errors due to sampling processes.
Ready to make your property smarter and more secure? Connect with Kastle's experts to find the perfect solution tailored to your needs.

 Workplace Occupancy Barometer
 Legal Occupancy Barometer
 Barometer Data Science