
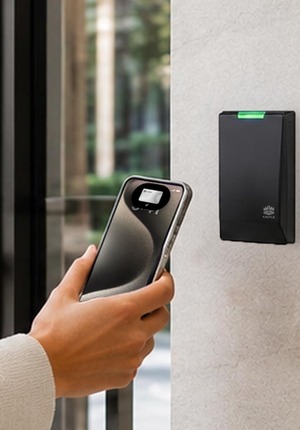
Access control solutions
Explore access control solutions that simplify access management, strengthen security, and create seamless experiences for employees and visitors.
Read more
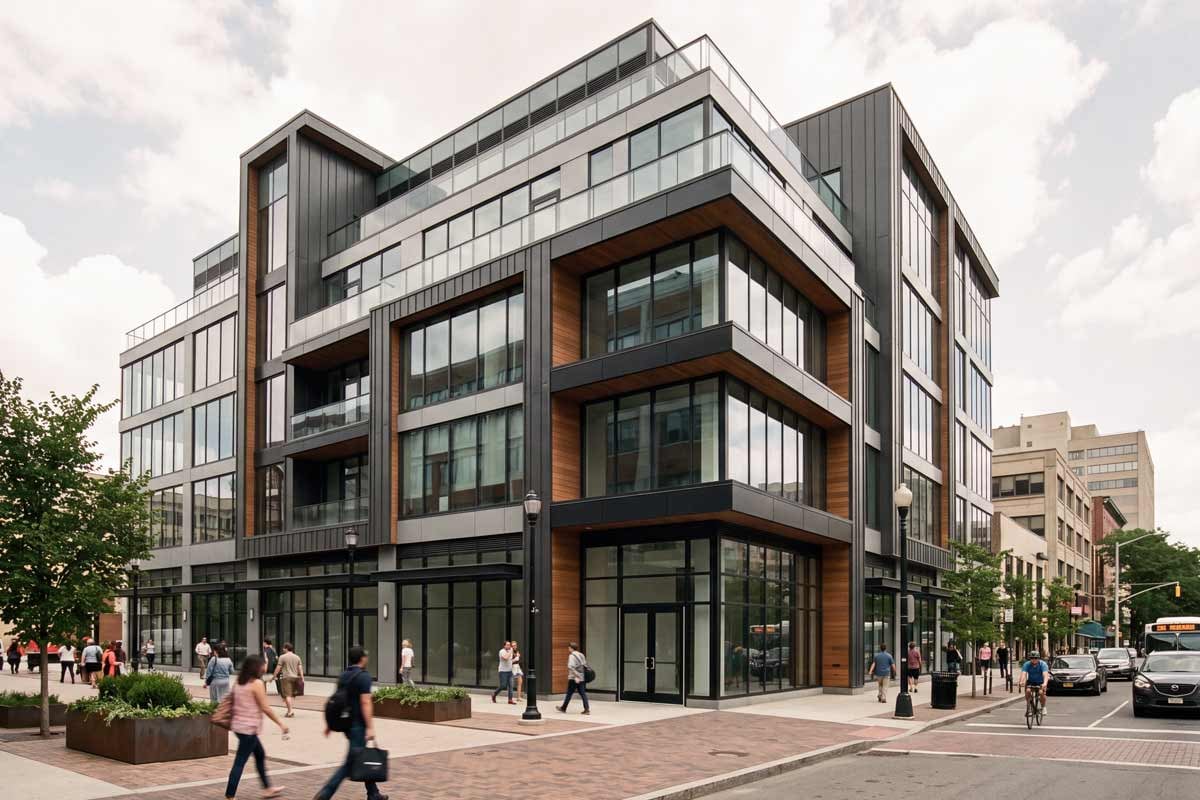
Office occupancy is a key indicator of how commercial real estate is performing, offering insight into how businesses are using their space. In many markets, Class A+ buildings have continued to attract tenants and command higher rents, even as the broader office sector adjusts to modern ways of working. The Kastle Occupancy Barometer adds to this picture with aggregated, real-world occupancy data that tracks how buildings are used day to day.
The Kastle Occupancy Barometer tracks anonymized keycard, fob, and mobile app access data from over 300,000 Kastle users across 10 major cities to identify trends in how Americans are returning to the office. Over time, the data can assist with return-to-office plans.
Counting daily access control entries is the most reliable way to measure office return, with the largest sample size of its kind. Occupancy is measured against a pre-pandemic baseline established in early 2020, just before COVID-19 disrupted office attendance. Data is updated weekly, with monthly charts available to track trends.
See how occupancy rates change monthly for business offices across America.
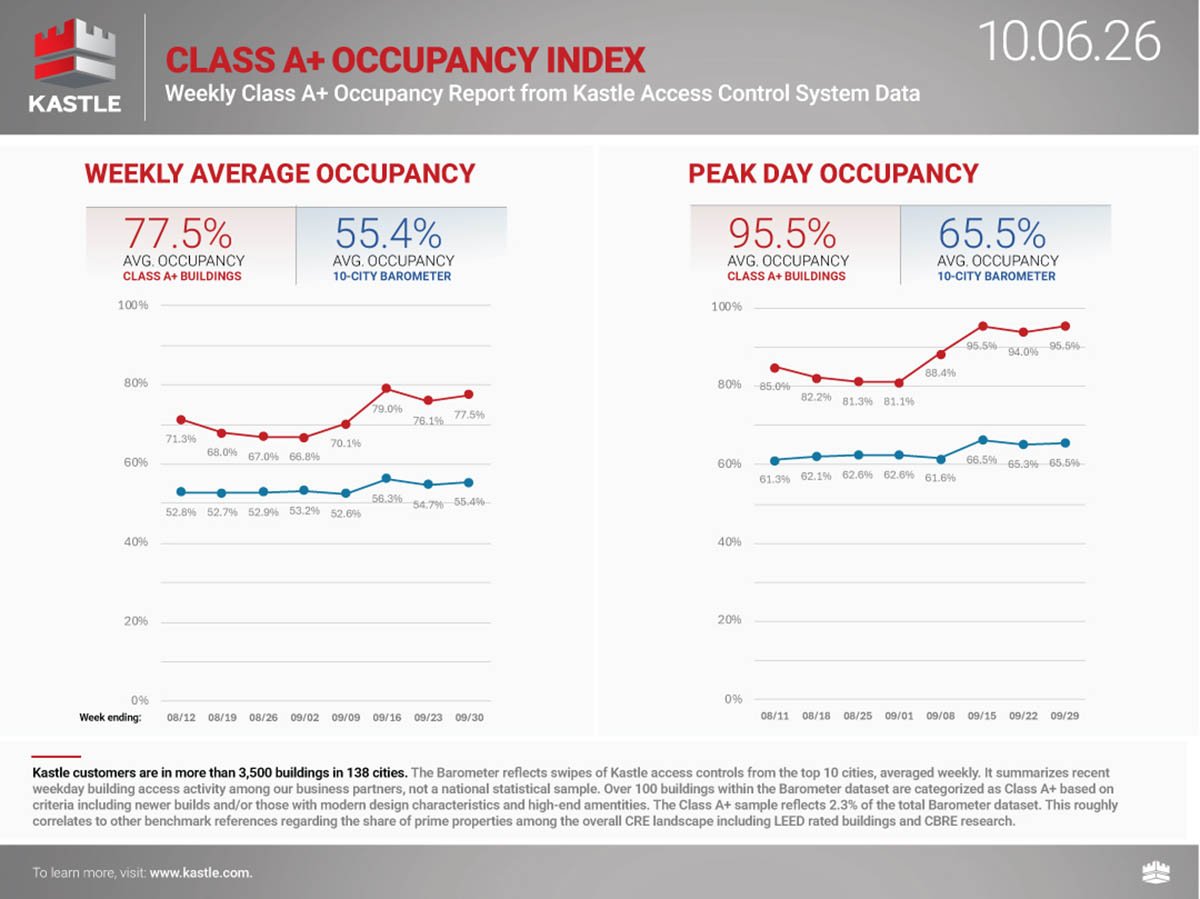
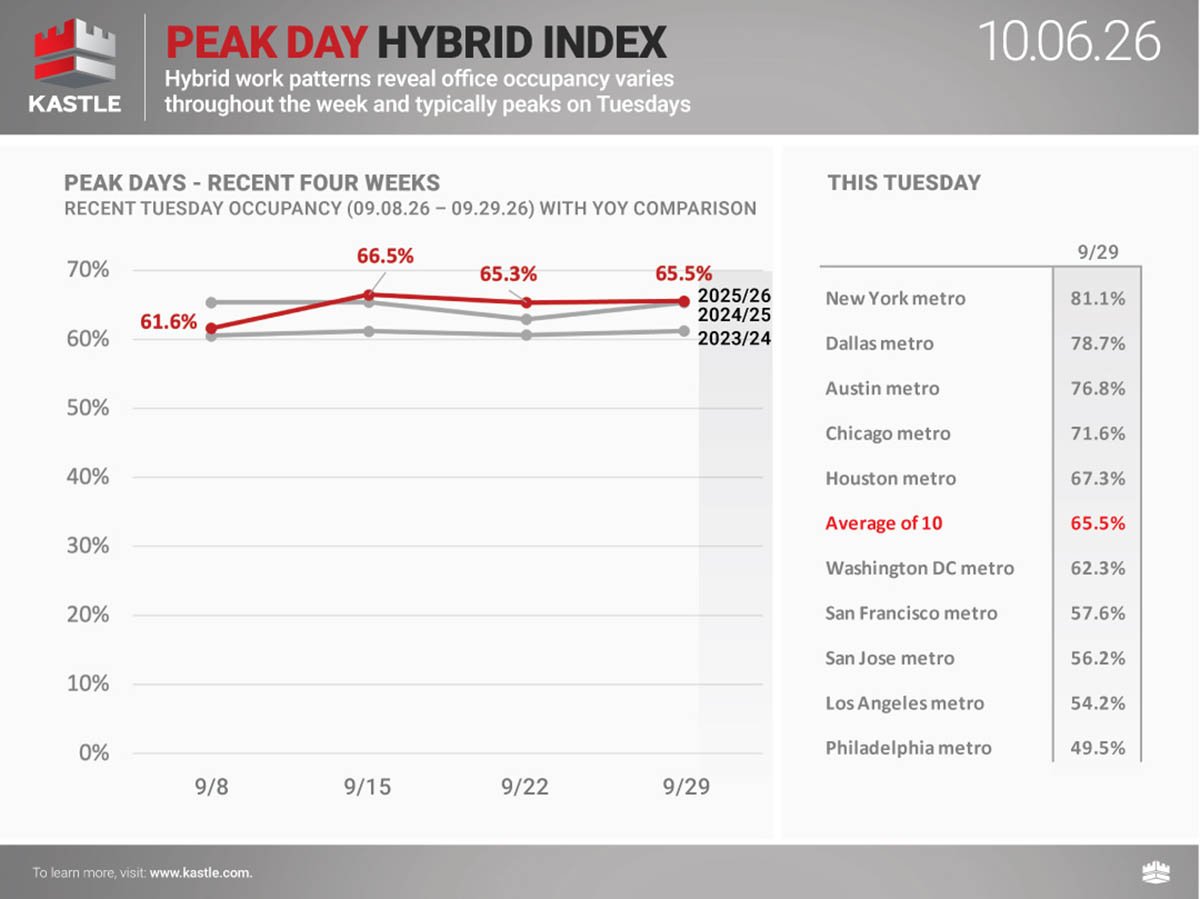
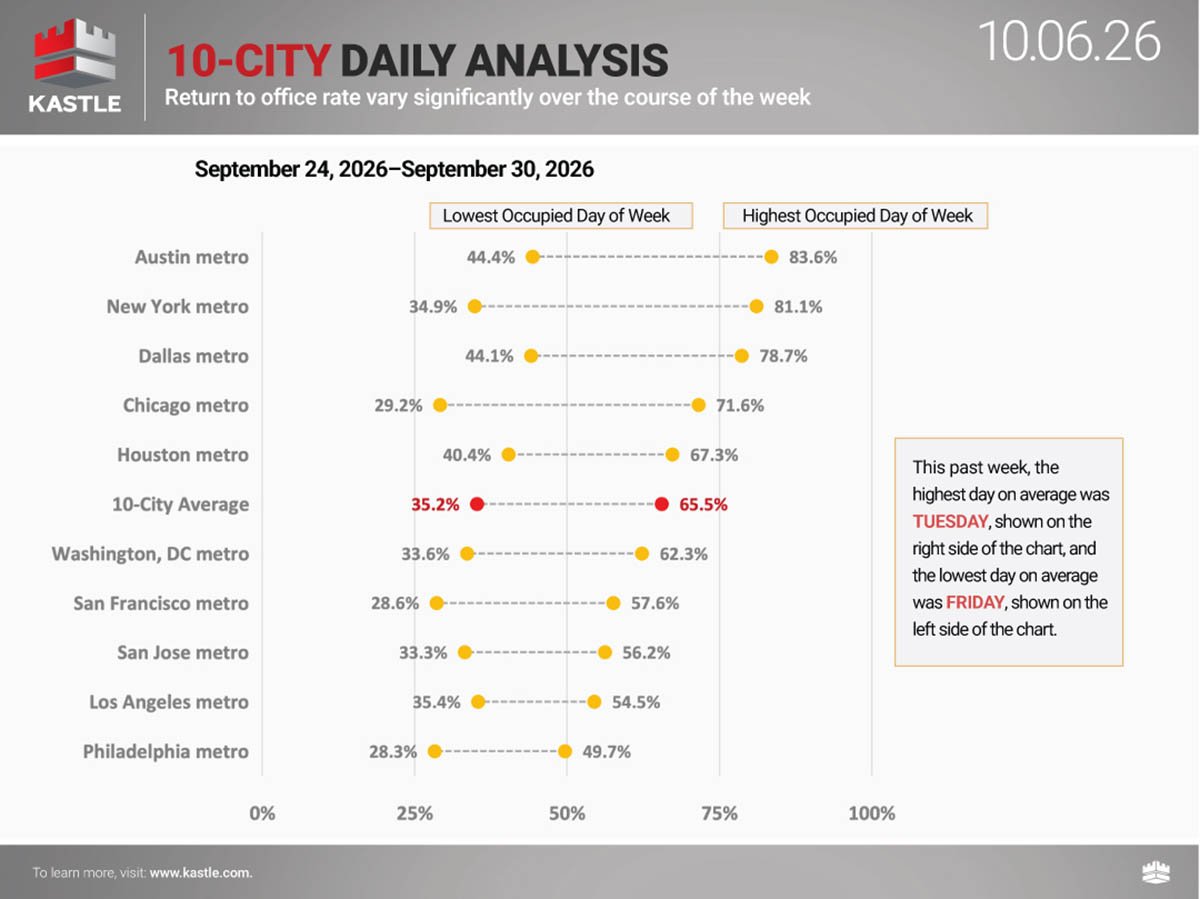
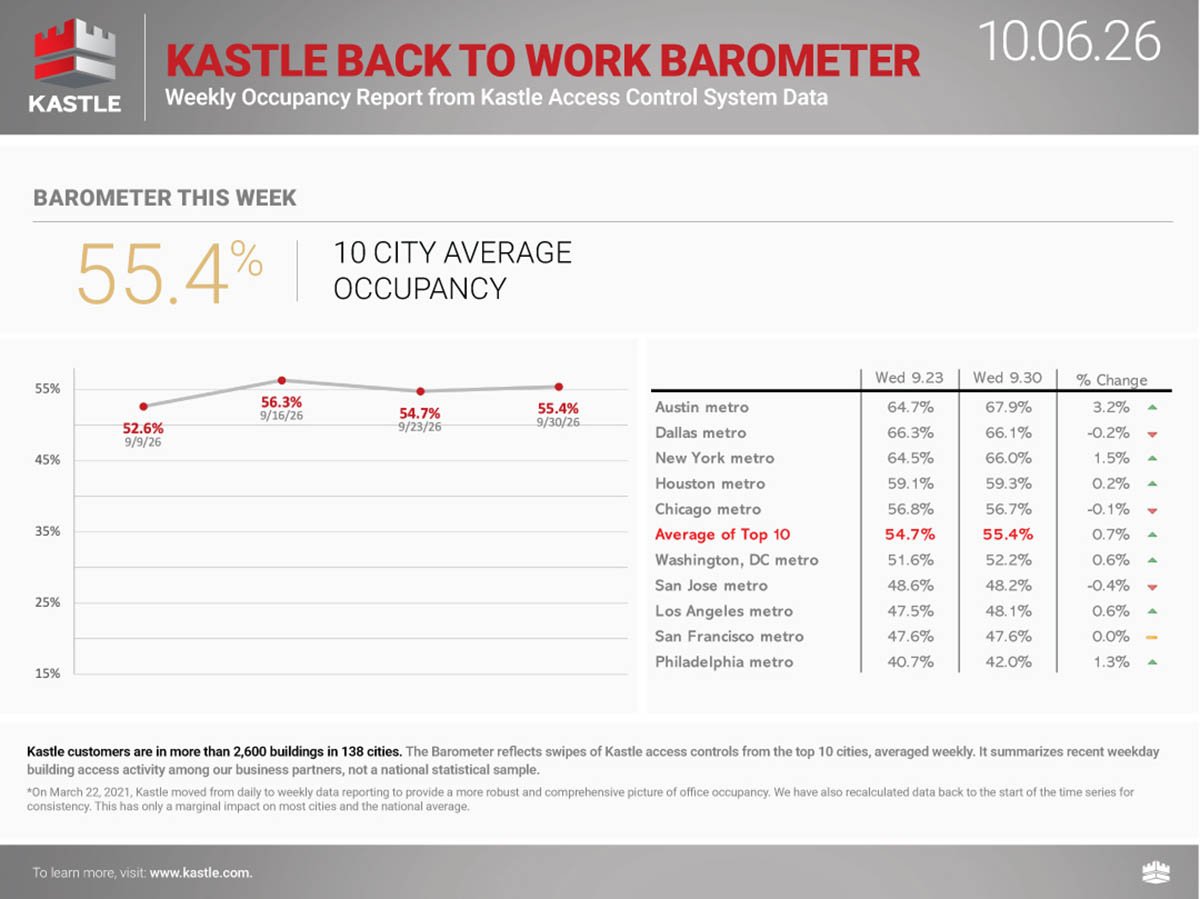
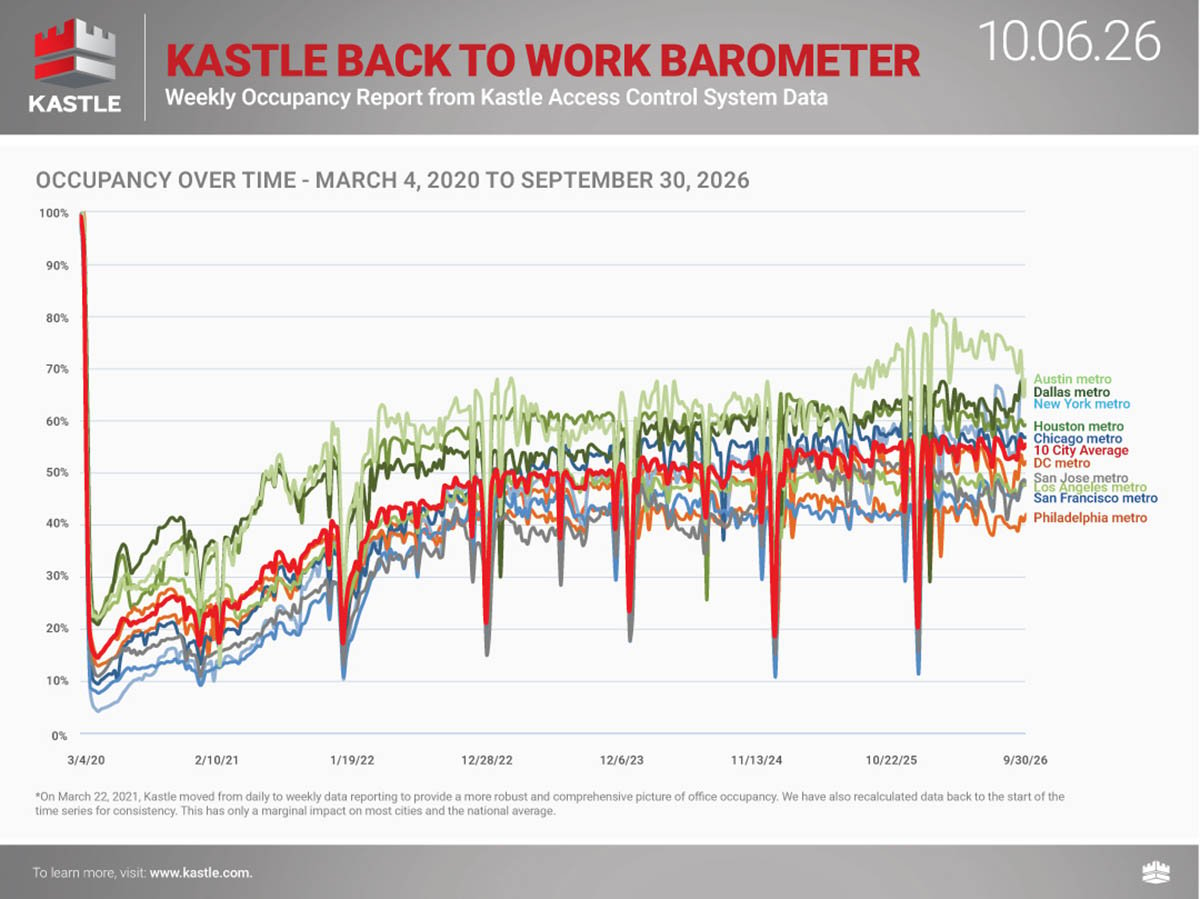
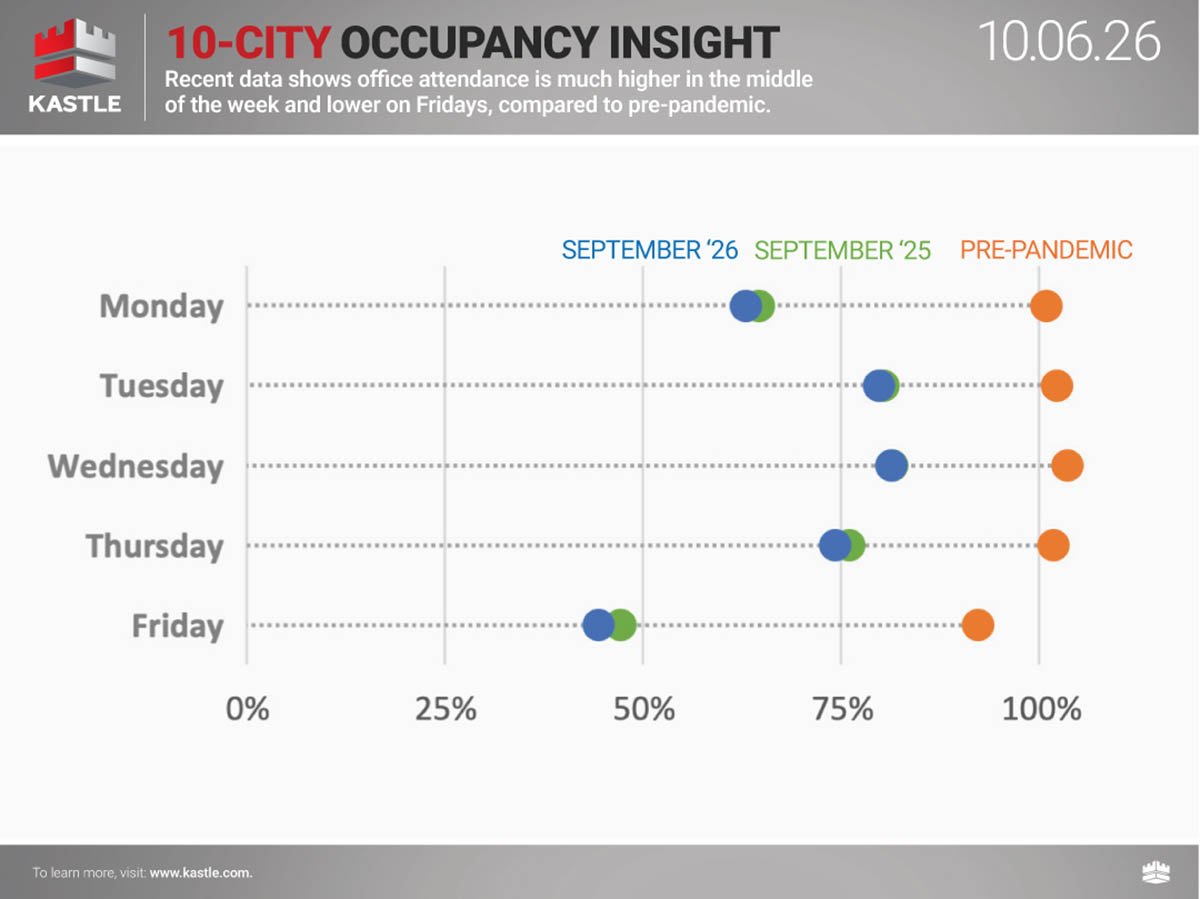
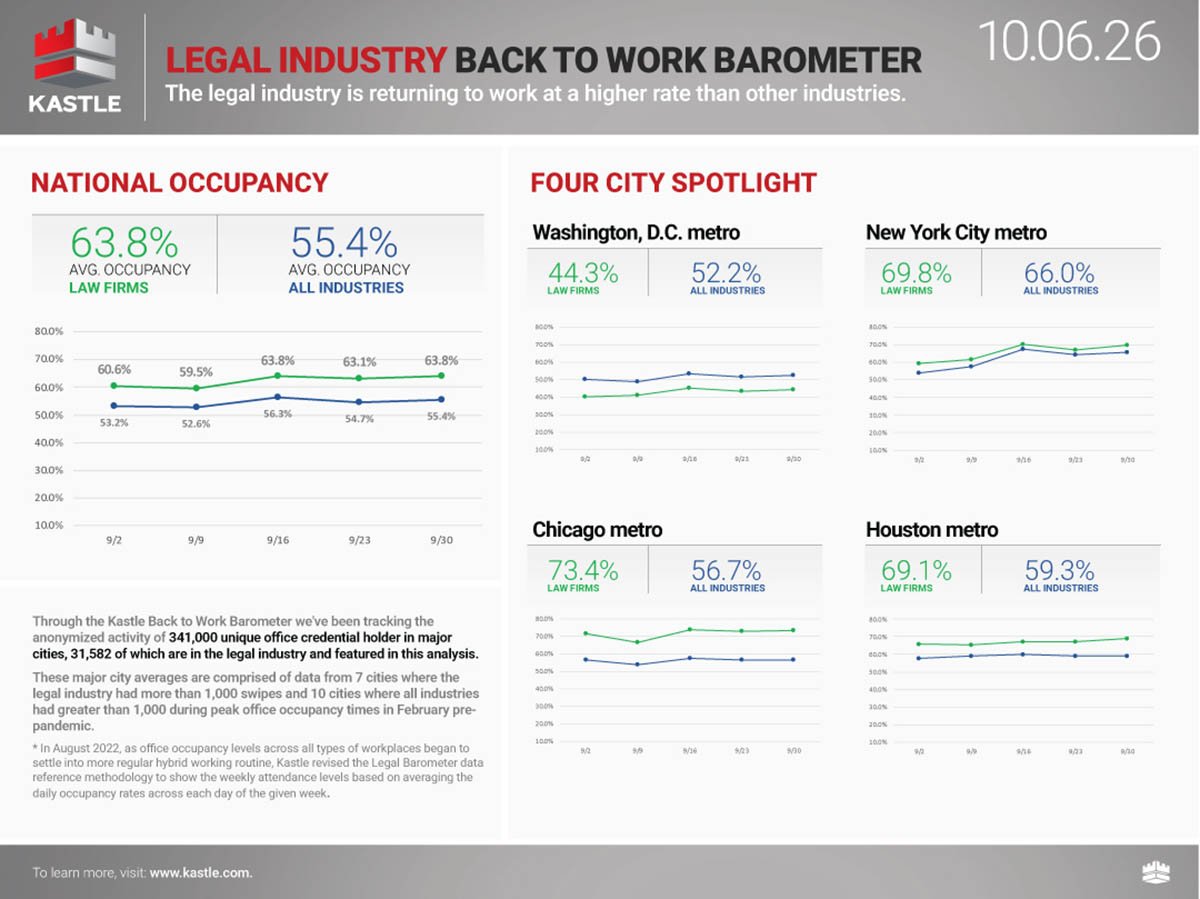
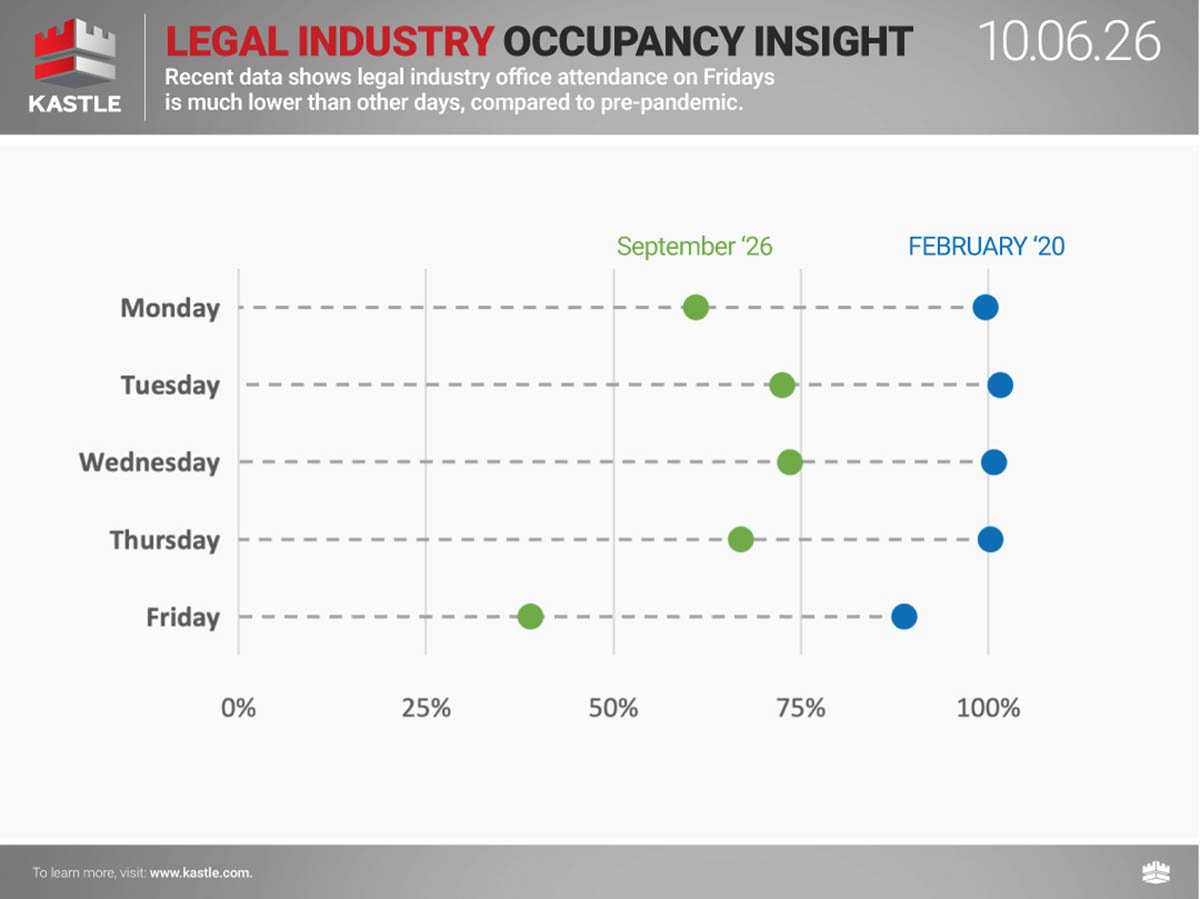
These headlines summarize access control data from our business partners in 10 major metro areas, not a national statistical sample. Charted percentages reflect the number of unique authorized user entries in each market relative to a pre-COVID-19 baseline, averaged and updated weekly.
The national average occupancy in Class A+ buildings fell to 76.2% this week, down 1.3 points from the previous two-week average of 77.5%.
The peak day for all building classes was Tuesday, down from 68.8% the previous week to 64.4%.
National average occupancy in the Kastle Occupancy Barometer fell from 56% to 55.1%.
The most reliable way to measure office return is to count people directly, and daily security card swipes provide the largest sample size for this. For several years, the Kastle Occupancy Barometer has tracked weekly office occupancy in 10 major metro areas, using anonymized keycard, fob, and KastlePresence app data from over 300,000 Kastle users in those cities (out of 1.8 million Kastle users globally) across 3,400 buildings and 60,000+ businesses in 47 states.
For each person, we count only their first building entry each day, avoiding overcounting from multiple swipes. Using our occupancy rate formula, we average these daily figures into a weekly percentage.<br>That percentage is compared against a pre-pandemic baseline: the average weekly first-swipe activity during a three-week window in February 2020, when office attendance was at its highest. This baseline represents 100% and reflects normal peak occupancy rather than maximum capacity, which is why some weeks can register above 100%.
Access control solutions
Explore access control solutions that simplify access management, strengthen security, and create seamless experiences for employees and visitors.
Read more

Remote monitoring solutions
Explore 24/7 remote security monitoring solutions that detect threats, enable real-time response, and help prevent incidents before they escalate.
Learn more
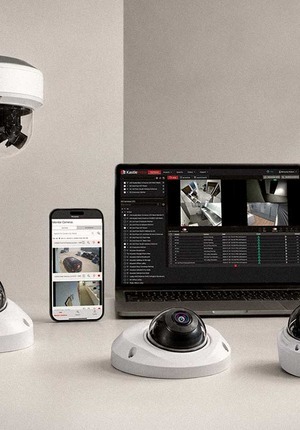
Complete guide to physical security
A practical approach to assessing physical security, from evaluating access points and camera coverage to reviewing incident response procedures.
Read more
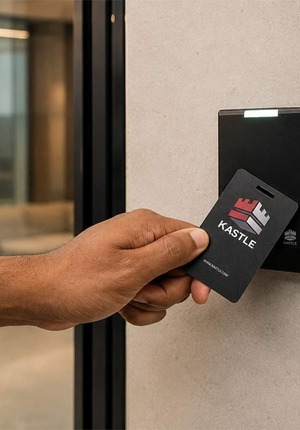
Key card entry systems: What businesses get wrong, and how to choose one
Five common mistakes businesses make when choosing a key card system, along with what it takes to manage access effectively.
Read more