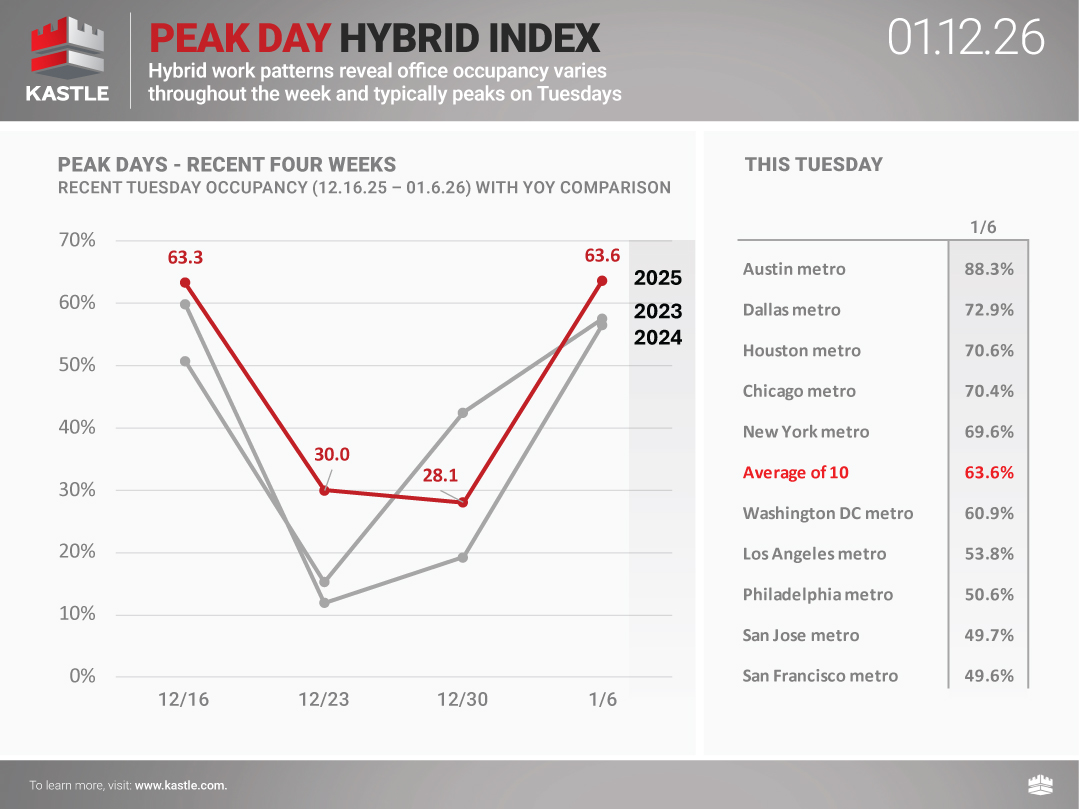
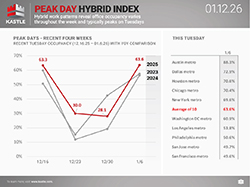
Hybrid work patterns reveal occupancy varies throughout the week with Tuesdays typically being the highest day of the week and Fridays being the lowest. The chart below tracks Tuesday occupancy over time in ten cities and provides a new dimension to the weekly Barometer report. The Peak Day Hybrid Index will now be published weekly, offering a wider aperture into the full picture of workplace occupancy.
Get Weekly UpdatesYou can now track the Return to Work Barometer on the Bloomberg Terminal, available under {ALLX KASL<GO>}
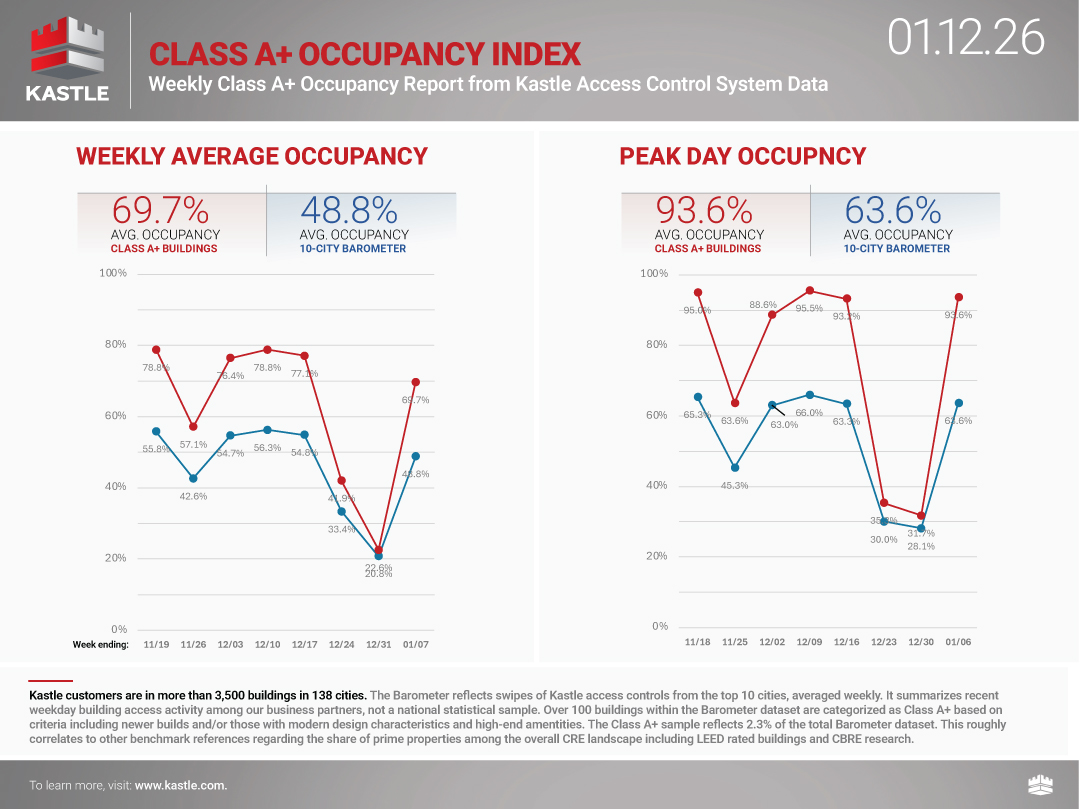
Class A+ Occupancy
A massive winter storm swept the nation this past week, keeping many workers away from the office. In Class A+ buildings, occupancy dropped more than 17 points for the week, to 61.8%, proportionally similar to the drop in all buildings (down about 11 points to 45.3% occupancy). Monday’s single day occupancy of 22.9% in A+ buildings was a record low for any day since the pandemic lockdowns, excluding days around the December holidays.
Peak Day
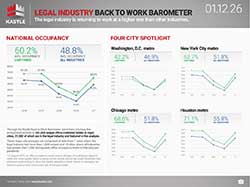
The extreme winter weather also kept workers away from the office across the nation last week. Monday occupancy in Washington DC (5.9%), Philadelphia PA (7.3%), and Dallas TX (4.8%) all fell to record lows for any single day since Covid lockdowns. Tuesday occupancy in Washington DC was only 16.5%, 46 and a half points lower than the Tuesday prior. Dallas saw a more than a 61-point drop on Tuesday, at 10.7%.
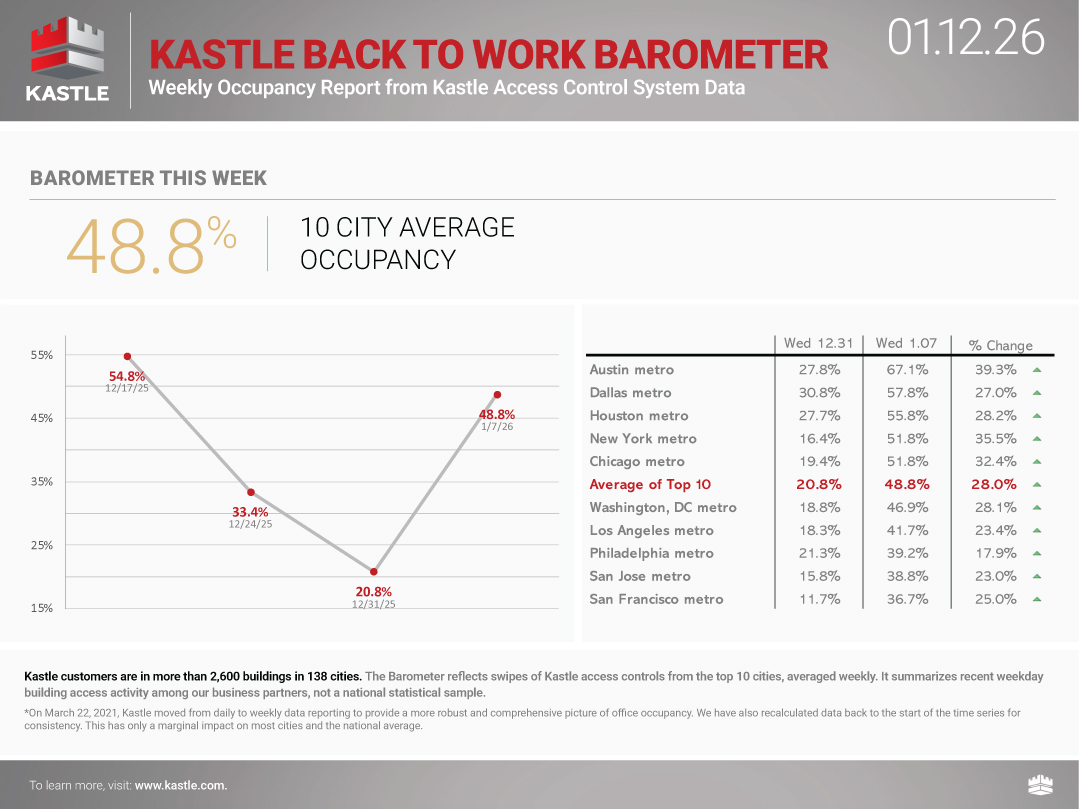
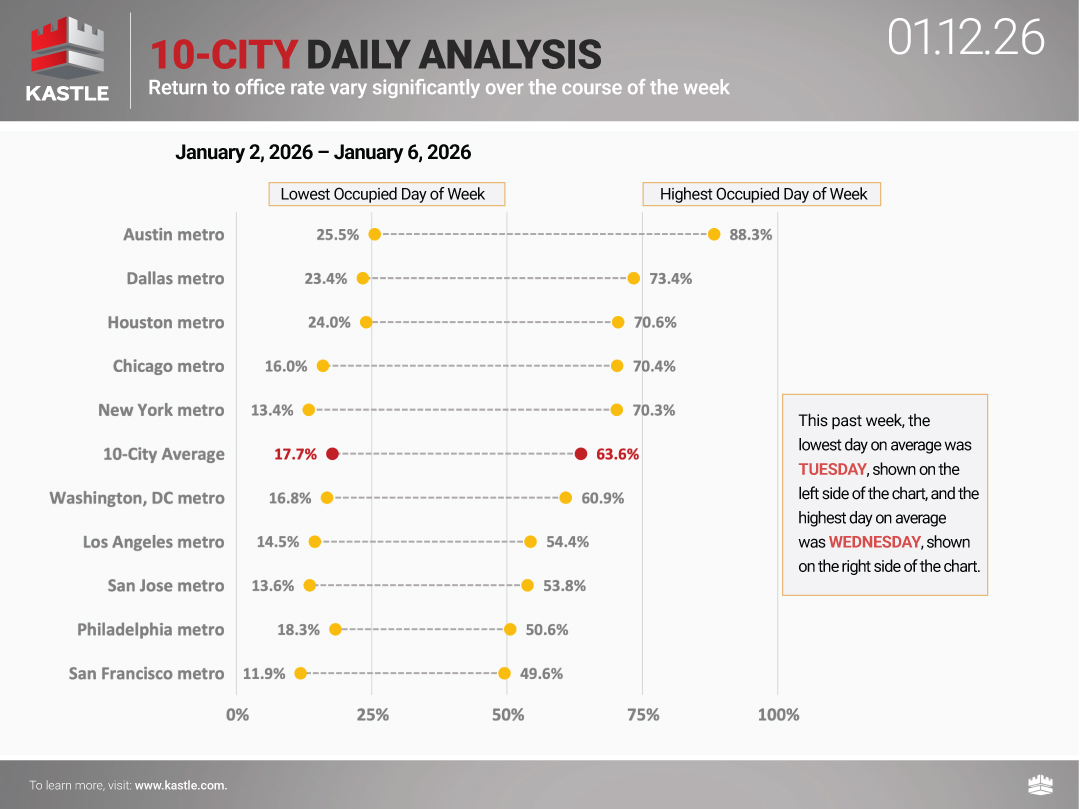
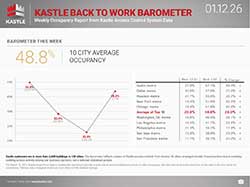
Weekly Average
Office occupancy fell across the nation as the 10 City Back to Work Barometer fell more than 11 points, to 45.3%. Eight of ten cities on the Barometer experienced occupancy declines. Dallas saw its average for the week fall 36 points, to 29.2%, the largest decline of any city, followed by Washington DC (down 24 points, to 31.1%) and Austin TX (down 18 points, to 58.0%). Only San Jose CA (up 1.1 points to 51.7%) and San Francisco (up 1.7 points to 46.0%) bucked the trend; San Francisco’s occupancy was its highest average week for the past year.
Methodology
To provide some clarity on the issues facing American businesses, Kastle has been studying keycard, fob and KastlePresence app access data from the 2,600 buildings and 41,000 businesses we secure across 47 states. We’re analyzing the anonymized data to identify trends in how Americans are returning to the office.
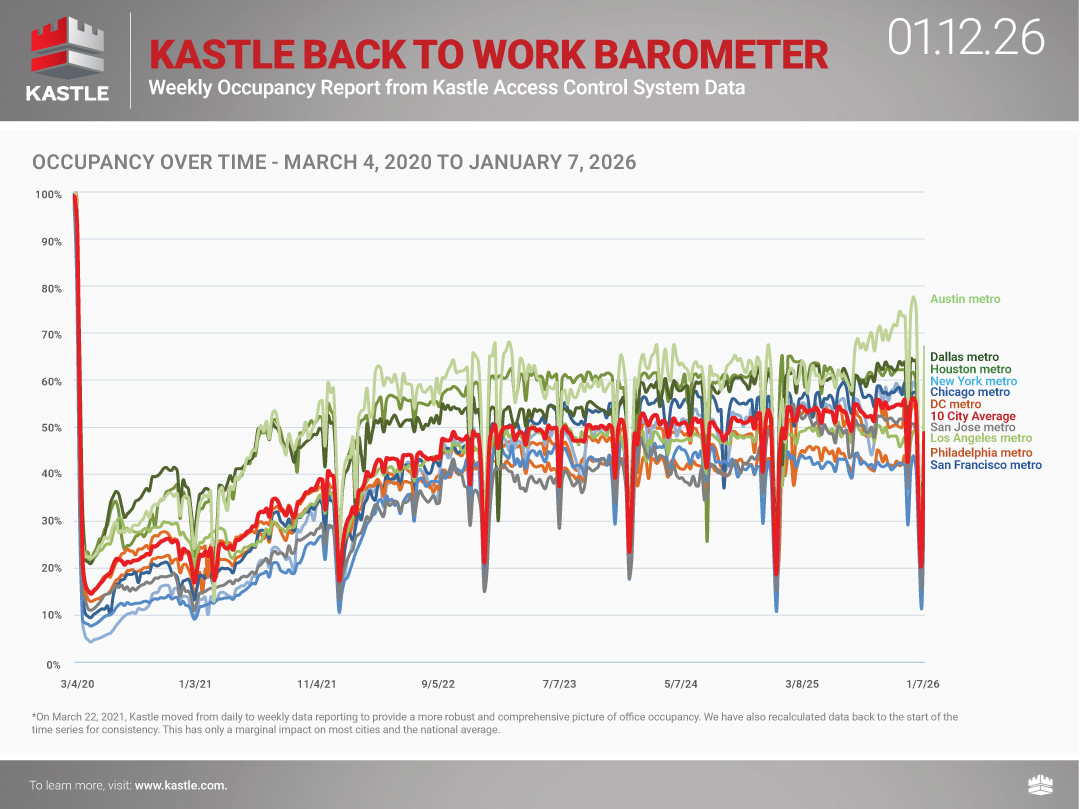
We have tracked and published U.S. office occupancy status in Kastle-secured commercial properties since the beginning of the Covid crisis in early 2020. We continue to seek to help companies navigate the ever-changing workplace landscape and adjust to the ‘new normal’ of office occupancy. Whether full-time hybrid or in-person, our commitment remains to helping American businesses understand how average workplaces are being attended weekly, monthly, and annually.
Kastle’s reach of buildings, businesses and cardholders secured generates millions of access events daily as users enter office complexes, and individual company workspaces. The Barometer weekly report summarizes access control data among our business partners in ten major metro areas, not a national statistical sample. Charted percentages reflect unique authorized user entries in each market relative to a pre-COVID baseline, averaged weekly.*
*On March 22, 2021, Kastle moved from daily to weekly data reporting to provide a more robust and comprehensive picture of office occupancy. We have also recalculated data back to the start of the time series for consistency. This has only a marginal impact on most cities and the national average.
Click here for more information about the Barometer methodology and FAQ
Ready to make your property smarter and more secure? Connect with Kastle's experts to find the perfect solution tailored to your needs.

![]()
 Workplace Occupancy Barometer
 Legal Occupancy Barometer
 Barometer Data Science