
For four years, Kastle’s proprietary Back to Work Barometer has provided an inside view of the cultural shift toward the hybrid working world we live and work in today. The return to work has reflected a new work week pattern featuring a migration of weekly attendance to be more concentrated in the three middle days of the workweek, Tuesday, Wednesday, and Thursday, with the peak rate typically happening on Tuesday or Wednesday. While this pattern continues, the good news for real estate owners is that the peak rates are continuing to rise.
We launched the Back to Work Barometer tracking office attendance in the weeks that followed the shutdown to support our clients and key decision makers who wanted a tangible view of the resulting impact on occupancy at that time. We had no idea then that this data would become a national index for commercial real estate. Yet the data is now providing us with deeper insights into the new hybrid work experience.
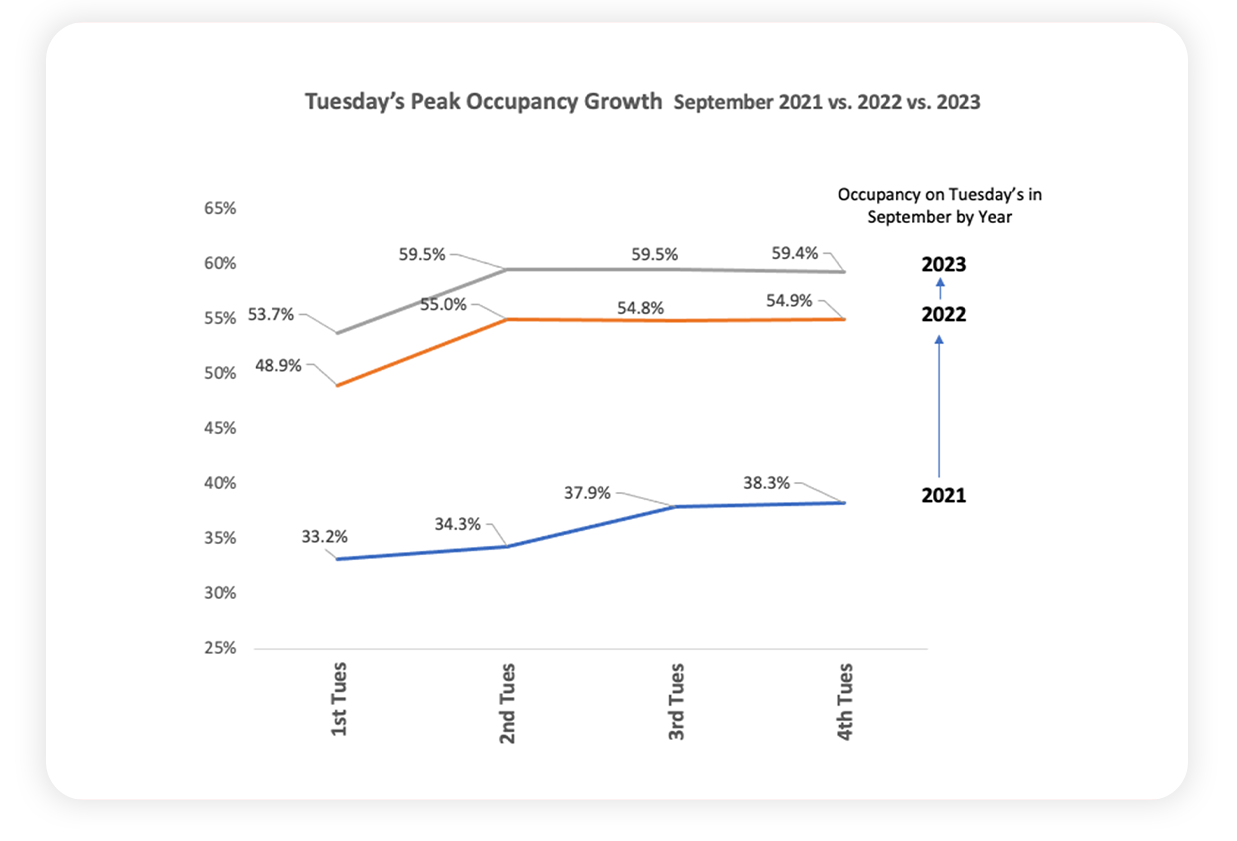
We published an article back in the Fall about how our Back-to-Work Barometer national occupancy data showed that peak day workplace attendance was continuing to climb consistently over time comparing peak days each week in September between 2021-2023. (See chart below.)
Five months ago, we were trumpeting the fact that average weekly workplace attendance had set its post-pandemic record of 50.4% when the bigger story was the national high point hit 59.5% on the peak day that month.
Since then, the growth in occupancy has continued with February showing a peak day attendance up to 63.1% and the weekly average hitting a post-pandemic high of 53.0%
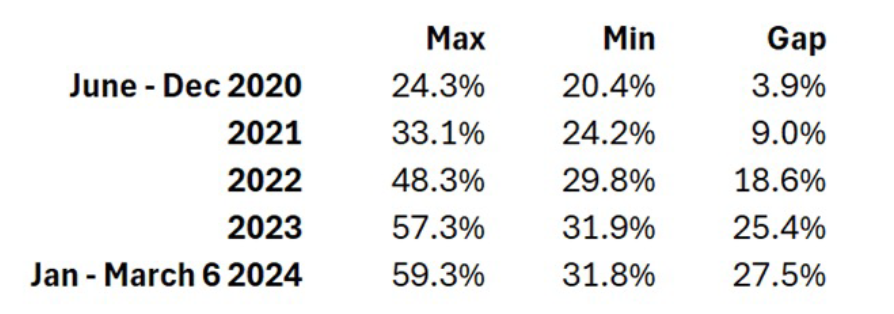
Interestingly, while the average of those peak days (Tuesday-Thursday) continues to rise, the weekly average of the two low attendance days, Monday, and Friday, has stabilized. There is a widening gap between weekly peak attendance and the weekly low point that has been happening for some time.
See the figure below comparing Monday through Friday workplace attendance across the same second week of February in 2022 and 2024. Note how Tuesday, Wednesday, and Thursday have separated from Monday and Friday, with these peak days growing noticeably faster since 2022, while Monday and Friday have remained more consistent over the same period.
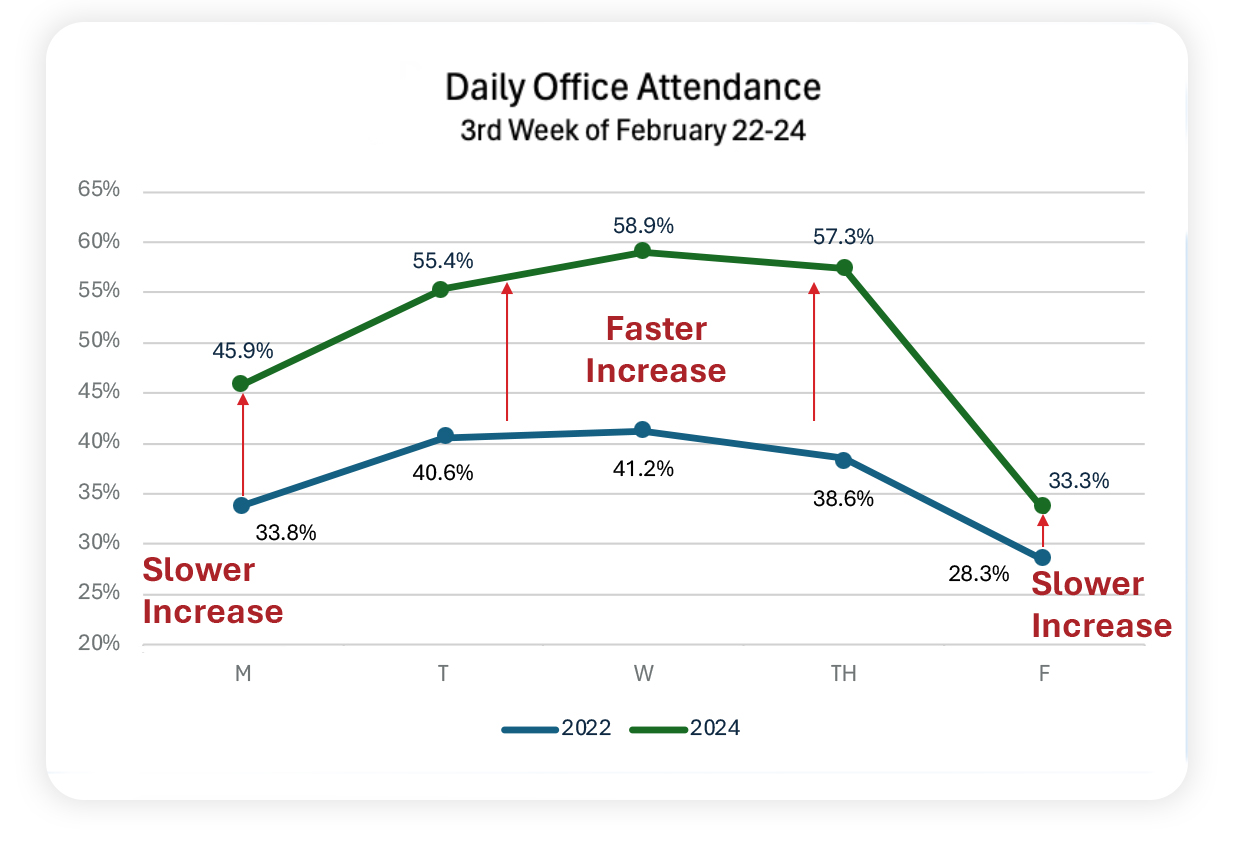
This behavior is showing a wider adoption of the 3-day hybrid workweek over time across the workforce and nation. The peak is going up, but the low point is staying put. You can more dramatically see the change by just comparing the average single peak day of all 2022 and 2023 and current 2024 YTD versus the low point average of each week.
This is adding more nuanced understanding of the full 5-day Barometer weekly average by highlighting how hybrid work routines are driving dynamic differences between peak and low day attendance rates. We will continue to monitor this and other deeper insights in our unique dataset, but it seems to be telling us that the true office occupancy is better tracked with the peak than the average counts.
We will begin to focus more of our analysis on this behavior in a new report called “Peak Day Hybrid Index” rather than just the full weekly average which underrepresents actual office attendance in a hybrid world. We welcome any feedback and hope you find the data useful.