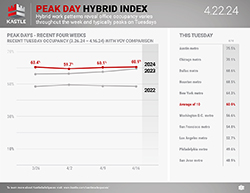
Hybrid work patterns reveal occupancy varies throughout the week with Tuesdays typically being the highest day of the week and Fridays being the lowest. The chart below tracks Tuesday occupancy over time in ten cities and provides a new dimension to the weekly Barometer report. The Peak Day Hybrid Index will now be published weekly, offering a wider aperture into the full picture of workplace occupancy.


Get Weekly UpdatesYou can now track the Return to Work Barometer on the Bloomberg Terminal, available under {ALLX KASL<GO>}


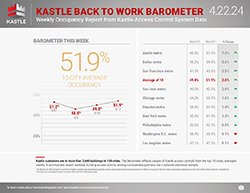
Peak Day Occupancy Hovers Above 60%
Office attendance rose this past week, with the peak day occupancy reaching 60.9% on Tuesday — eight tenths higher than last week — according to Kastle’s Peak Day Hybrid Index.
Out of the ten cities tracked, Austin, Texas had the highest occupancy rates, reaching 77.3% on Wednesday. Austin’s Friday occupancy (49.7%) was even higher than the peak day in San Jose, California (48.9%). The largest spread between peak and low day was in Chicago, where occupancy hit 70.1% on Tuesday, but went down to 30.0% on Friday.
The weekly average rose two points to 51.9%, with nearly all cities seeing an increase, according to Kastle’s 10-city Back to Work Barometer.
Methodology
To provide some clarity on the issues facing American businesses, Kastle has been studying keycard, fob and KastlePresence app access data from the 2,600 buildings and 41,000 businesses we secure across 47 states. We’re analyzing the anonymized data to identify trends in how Americans are returning to the office.
We’re ready to continue helping companies navigate the ever-changing workplace landscape and adjust to the ‘new normal’ of office occupancy. Whether full-time hybrid or in-person, our commitment remains to helping American workers return safely to their office buildings. We have a comprehensive system in place that integrates technology and new safety protocols — both for the building and tenant spaces. We’re keeping a close eye on this data as part of our KastleSafeSpaces framework, which we designed to help office buildings throughout workplace transitions.
Kastle’s reach of buildings, businesses and cardholders secured generates millions of access events daily as users enter office complexes, and individual company workspaces. The Barometer weekly report summarizes access control data among our business partners in ten major metro areas, not a national statistical sample. Charted percentages reflect unique authorized user entries in each market relative to a pre-COVID baseline, averaged weekly.*
*On March 22, 2021, Kastle moved from daily to weekly data reporting to provide a more robust and comprehensive picture of office occupancy. We have also recalculated data back to the start of the time series for consistency. This has only a marginal impact on most cities and the national average.
Click here for more information about the Barometer methodology and FAQ
 Workplace Occupancy Barometer
 Legal Occupancy Barometer
 Barometer Data Science